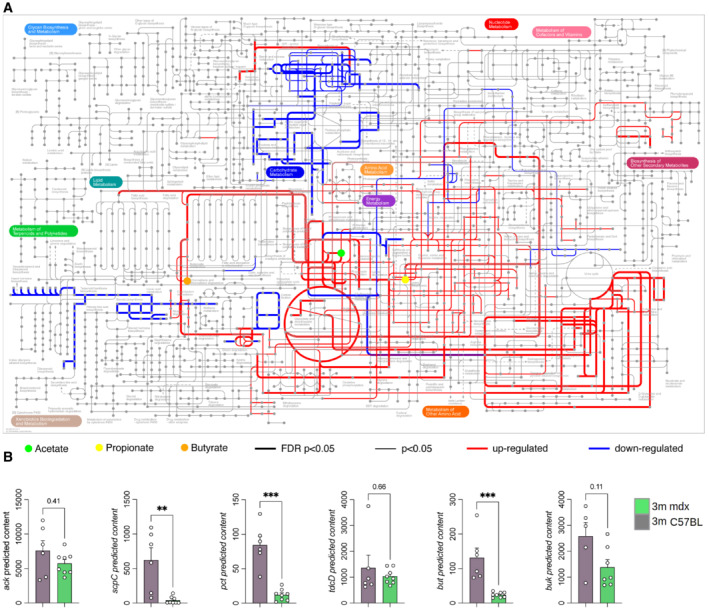
Figure 3. Metabolic maps of 3m mdx mice.

- The iPath3.0 representation of KEGG metabolic pathways inferred from Piphillin analysis significantly upregulated (in red) or downregulated (in blue) in 3m C57Bl (n = 6) versus 3m mdx (n = 8) mice. Nodes in the map colored in green, yellow, and orange correspond to acetate, propionate, and butyrate, respectively. Line thickness represents the level of statistical significance for the inferred pathways; thick lines with FDR‐corrected P‐value < 0.05, thin lines with nominal P‐value < 0.05.
- Predicted metagenomic gene content of the key enzymes catalyzing the final steps for the production of microbiota‐derived SCFAs in GI of 3m C57Bl (n = 5/6) and 3m mdx (n = 7/8) mice. Data are presented as mean ± SD (**P < 0.01, ***P < 0.001; Kruskal–Wallis test).
Source data are available online for this figure.
