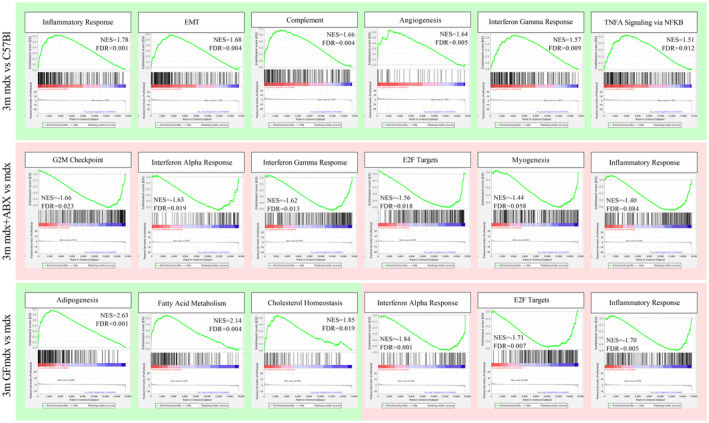
Figure EV3. Gene set enrichment analysis of 3m C57bl, mdx, mdx+ABX, and GFmdx mice RNA sequencing data.

The annotated dataset “Hallmark” collection by the Molecular Signatures Database (MSigDB) was used as a reference. A green background refers to positive Normalized Enrichment Score (NES) (enrichment in positive phenotype, or upregulation); a red background refers to negative NES (enrichment in negative phenotype, or downregulation). FDR, false discovery rate. Genes involved in inflammatory response, epithelial‐to‐mesenchymal transition, complement activity, angiogenesis, and interferon‐γ response are upregulated in 3m mdx (n = 3) versus age‐matched C57Bl (n = 3) mice (top lane). Genes involved in G2M checkpoint transition, interferon‐α and ‐γ response, E2F transcriptional activity and myogenesis are downregulated in 3m mdx+ABX (n = 3) versus age‐matched mdx (n = 3) mice (mid lane). Genes involved in adipogenesis, fatty acid metabolism, and cholesterol homeostasis are upregulated in 3m GFmdx (n = 3) versus age‐matched mdx (n = 3) mice; conversely, genes involved in interferon‐alpha response, E2F transcriptional activity, and inflammatory response are downregulated in the 3m GFmdx versus age‐matched mdx mice (bottom lane).Source data are available online for this figure.
