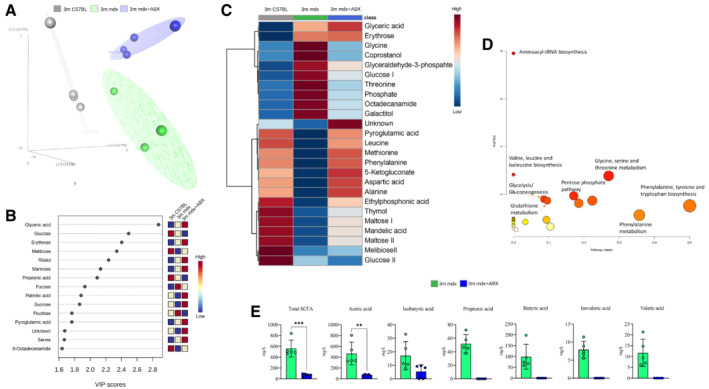
Figure 4. Characterization of gut tissue metabolome in 3m mdx mice and following antibiotics treatment.

- Partial least square discriminant analysis (PLS‐DA) models score plot used to evaluate the differences among 3m C57B1 (in gray), 3m mdx mice (in green) and 3m mdx+ABX (dark purple), with n = 4 each.
- Relevant metabolites (top variable importance in projection score) in the corresponding PLS‐DA separation, in blue metabolites with a negative fold change and in red metabolites with a positive fold change.
- Heatmap showing all the relevant metabolites concentration change among the groups. Both metabolites and classes were clusterized according to the Wald method. In blue metabolites' concentration with a negative fold change and in red metabolites' concentration with a positive fold change.
- Metabolic pathways involving the relevant metabolites obtained using the MetPa algorithm. The color and size of each circle are based on the P‐value and pathway impact value, respectively. The x‐axis represents the pathway impact, and the y‐axis represents the −log of P values from the pathway enrichment analysis for the key differential metabolites of 3m mdx and 3m mdx+ABX mice.
- Fecal content quantification of SCFAs in 3m mdx and 3m mdx+ABX mice (n = 5 per group). Data equal to 0. Data are presented as mean ± SD (**P < 0.01, ***P < 0.001; Student's t‐test).
Source data are available online for this figure.
