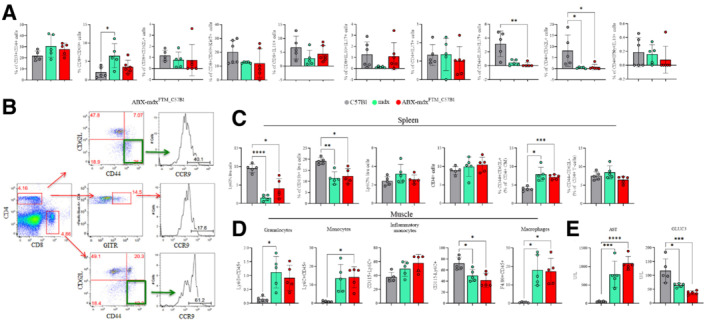
Figure EV4. Effects of dysbiotic microbiota of mdx on intestine, spleen and muscle inflammation.

-
AFACS analysis of colon lamina propria of mdx (n = 5) and ABX‐mdxFMT_C57Bl (n = 5/6) for quantification of T cell subsets.
-
BRepresentative plots of FACS analysis for the expression of CCR9 in ABX‐mdxFMT_C57Bl and ABX‐C57BlFMT_mdx are depicted. The numbers within the panels indicate the percentage of each population of live cells. Each analysis included at least 5–10 × 104 events for each gate.
-
C, DFACS analysis of T cells of the spleen (C) and granulocyte, monocyte and macrophage of muscle (D) tissues from mdx (n = 5) and ABX‐mdxFMT_C57Bl (n = 5/6).
-
ESerum levels of AST and GLUC3 in 3m C57Bl (n = 5), mdx (n = 5) and ABX‐mdxFMT_C57Bl (n = 6).
Data information: Data are presented as mean ± SD (*P < 0.05; **P < 0.01; ***P < 0.001; ****P < 0.0001 ordinary one‐way ANOVA, Tukey's multiple‐comparison test).
Source data are available online for this figure.
