
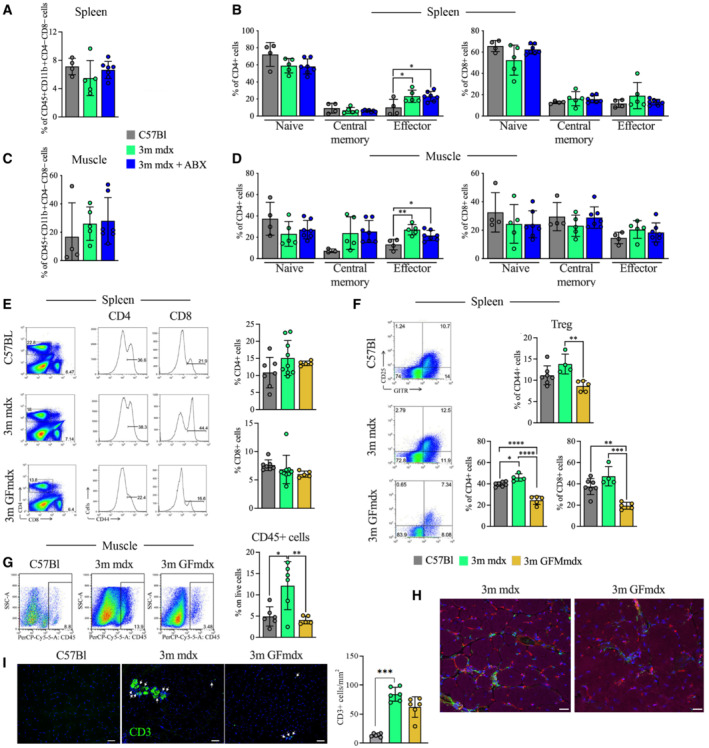
Figure 5. Microbiota depletion induces modulation of immune cells.
-
A–DFACS analysis of spleen and muscle homogenates from 3m C57Bl (n = 4), mdx (n = 5) and mdx+ABX (n = 7) mice demonstrates no significant alteration of CD45+CD11b+CD4−CD8− myeloid cells (A and C) and few differences in CD4+ or CD8+ naïve (CD62L+ CD44−), central memory (CD62L+ CD44+) and effector (CD62L− CD44+) T cells (B and D).
-
EFACS analysis of spleen of 3m C57Bl (n = 7), mdx (n = 9) and GFmdx (n = 5) mice revealed similar proportions of CD4+ and CD8+ T cells but reduced activated CD44+ T cells in GFmdx mice. Representative plots are depicted.
-
FGraphs show cumulative frequencies of CD4+ and CD8+ T cells on live cells of 3m C57Bl (n = 7), mdx (n = 4) and GFmdx (n = 5) mice. Representative dot plots and cumulative frequencies of splenic CD4+GITR+CD25+ Treg. Frequencies of effector CD44+ T cells were significantly decreased in spleen of GFmdx mice.
-
GRepresentative dot‐plots showing the proportion of muscle‐infiltrating CD45+ cells of 3m C57Bl (n = 6), mdx (n = 6) and GFmdx (n = 5) mice. Cumulative frequencies of muscle‐infiltrating CD45+ cells are shown.
-
HRepresentative images of TA muscles from 3m mdx and GFmdx mice stained for CD45 (in green), isolectin (in red), and phalloidin (in purple). Nuclei were counterstained with DAPI (in blue). Scale bar: 10 μm.
-
IAbsolute number of CD3+ inflammatory cells (white arrows) were quantified in n = 12 images of TA of 3m C57Bl, 3m mdx, and 3m GFmdx mice (n = 6 each). CD3 staining is shown in green and DAPI in blue. Scale bars: 50 μm.
Data information: Data are presented as mean ± SD. *P < 0.05; **P < 0.01; ***P < 0.001; ****P < 0.0001 ordinary one‐way ANOVA, Tukey's multiple‐comparison test. The comparisons among the averages of CD3+ cells were evaluated using unpaired t‐test.
Source data are available online for this figure.