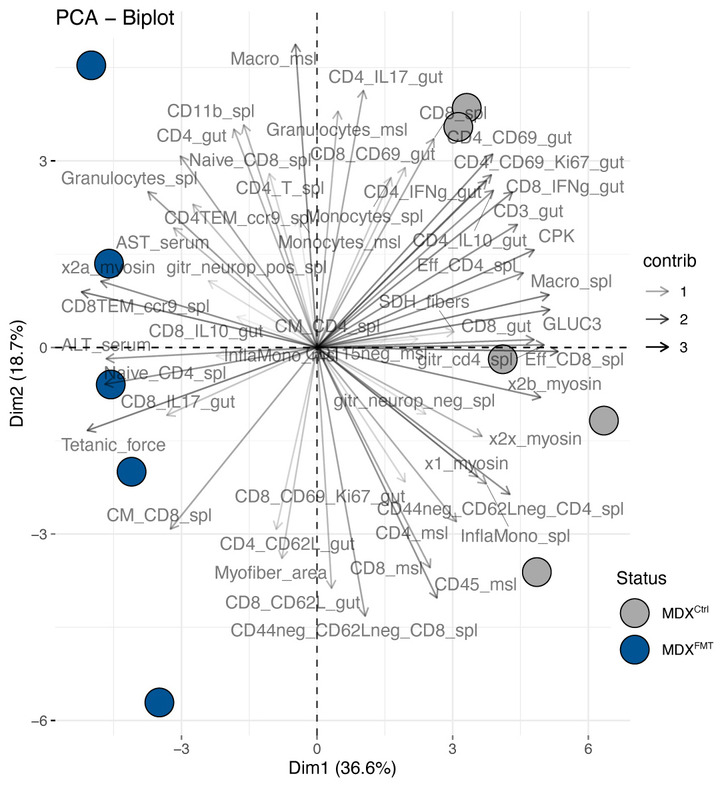
Figure EV5. Principal component analysis (PCA) biplot of samples and analyzed variables from spleen, gut, and muscle.

The biplot shows the PCA scores of the explanatory variables as vectors and samples colored according to treatment and genetic backgrounds. The color intensity of the vectors (lines) shows the strength of their contribution to each PC. Vectors pointing in similar directions indicate positively correlated variables, and vectors pointing in opposite directions indicate negatively correlated variables.
