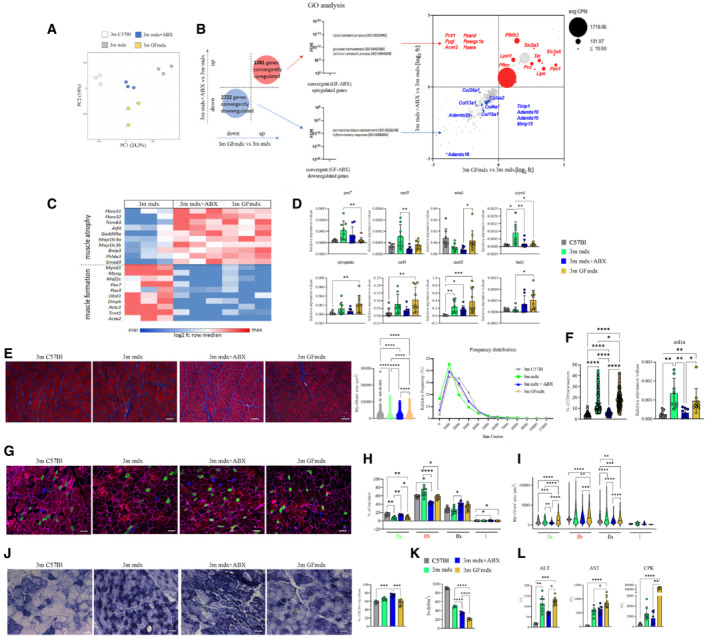
Figure 6. Muscle homeostasis of 3m mdx mice is influenced by microbiota.

-
A, BRNA datasets clustering (A) and convergently up‐ and downregulated genes (B) of muscles of 3m mdx (n = 3), mdx+ABX (n = 3) and GFmdx (n = 3) mice.
-
CGene ontology (GO) analysis on both groups of convergent genes.
-
DRT‐qPCR analysis of TA muscles of two independent experiments with 3m mdx (n = 4), mdx+ABX (n = 4), and GFmdx (n = 5) mice determined the expression of myogenic markers.
-
ERepresentative Gomori‐modified staining and quantification of myofiber area and relative frequency of the myofiber cross‐sectional area (CSA) expressed as the frequency distribution of the TA muscles of 3m C57Bl (n = 4), 3m mdx (n = 4), mdx+ABX (n = 4) and GFmdx mice (n = 5). Pooled samples for each group with n = 6,240 for 3m C57Bl; n = 6,001 for 3m mdx; n = 10,556 for 3m mdx+ABX; n = 23,059 for GFmdx. For morphometric analysis, images were quantified with Image J software for each mouse. Scale bars: 50 μm.
-
FQuantification of the fibrotic area from Gomori stained images (pooled samples for each group with n = 223 for 3m C57Bl, 3m mdx and 3m mdx+ABX; n = 215 for GFmdx) and RT‐qPCR analysis of Col1a (two independent experiments with n = 4 animals each group).
-
GRepresentative images of skeletal muscle showed the distribution and composition of the myosin heavy chain (MyHC) isoforms (Type IIa, Type IIx, and Type IIb).
-
H, IGraph portrays (H) the percentage of myofibers expressing different MyHC isoforms and (I) myofibers area per type of MyHC in TAs of 3m mdx (n = 4), mdx+ABX (n = 4), and GFmdx (n = 5) mice (n = 12 images per animal).
-
JRepresentative SDH staining and quantification of percentage of SDH+ myofibers of TAs from 3m mdx (n = 4), mdx+ABX (n = 4), and GFmdx mice (n = 5) (n = 12 images per animal). Scale bars: 50 μm.
-
KTetanic force of TA muscle of 3m C57Bl (n = 4), mdx (n = 4), mdx+ABX (n = 4), and GFmdx (n = 5) mice.
-
LALT, AST, and CPK serum levels were measured in 3m mdx (n = 4), mdx+ABX (n = 4), and GFmdx mice (n = 5) (two independent experiments).
Data information: Data are presented as mean ± SD (*P < 0.05, **P < 0.01, ***P < 0.001; ****P < 0.0001, ordinary one‐way ANOVA, Tukey's multiple‐comparison test for WB and non‐parametric test followed by Kruskal–Wallis test for RT‐qPCR).
Source data are available online for this figure.
