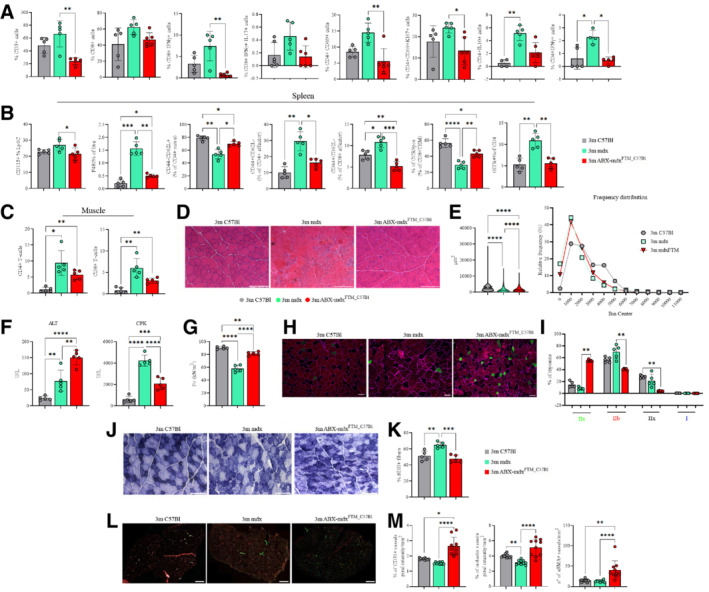
Figure 7. Effects of dysbiotic microbiota of mdx on intestine, spleen and muscle inflammation and muscle function.

-
AFACS analysis of T cell subsets from lamina propria in 3m C57Bl (n = 5), mdx (n = 5), and ABX‐mdxFMT_C57Bl (n = 5/6) showing decrease in CD3+ T cells in ABX‐mdxFMT_C57Bl. Infiltrating CD3+CD4+, and regulatory CD69+ subsets of CD4+ and CD8+ were decreased in ABX‐mdxFMT_C57Bl. Eubiotic FMT in mdx modulates T helper response, with reductions in the cumulative frequencies of CD4+ IFNγ+ (Th1) and CD4+ IL‐10+ cells in ABX‐mdxFMT_C57Bl. Data are presented as mean ± SD (*P < 0.05; **P < 0.01 ordinary one‐way ANOVA, Tukey's multiple‐comparison test).
-
BFACS analysis of spleen and muscle homogenates from 3m C57Bl (n = 5), mdx (n = 5), and ABX‐mdxFMT_C57Bl (n = 5/6). Analysis of the spleen revealed downregulation of Ly6C+ inflammatory monocytes and F4/80+ macrophages in ABX‐mdxFMT_C57Bl. Eubiotic FMT in mdx mice determined a decrease of CD4+/CD8+ CD44+CD62L effector and GITR+CD4+ T‐cells in ABX‐mdxFMT_C57Bl. Gut‐derived CCR9+CD8+TEM+ cells were increased in ABX‐mdxFMT_C57Bl. Data are presented as mean ± SD (*P < 0.05; **P < 0.01; ***P < 0.001; ****P < 0.0001, ordinary one‐way ANOVA, Tukey's multiple‐comparison test).
-
CGraphs showing cumulative frequencies of infiltrating CD45+CD4+ and CD45+CD8+ cells in muscles of 3m C57Bl (n = 5), mdx (n = 5) and ABX‐mdxFMT_C57Bl (n = 5/6) were decreased in ABX‐mdxFMT_C57Bl related to mdx mice. Data are presented as mean ± SD (*P < 0.05; **P < 0.01, ordinary one‐way ANOVA, Tukey's multiple‐comparison test).
-
D, ERepresentative H&E staining (D) and quantification of myofiber area with Image J software (E) of TA muscles from 3m C57Bl (n = 5), mdx (n = 5) and ABX‐mdxFMT_C57Bl (n = 6). Scale bars for H&E: 200 μm.
-
FMeasurement of ALT, and CPK in the serum of 3m C57Bl (n = 5), mdx (n = 5), and ABX‐mdxFMT_C57Bl (n = 6).
-
GTetanic force of TA muscles from mdx (n = 5) and ABX‐mdxFMT_C57Bl (n = 6).
-
HRepresentative images of skeletal muscle showed the distribution and composition of MyHC isoforms (Type IIa, Type IIx, and Type IIb). Scale bar: 50 μm.
-
IGraph portrays the percentage of myofibers expressing different MyHC isoforms. n = 12 images were analyzed for each mouse.
-
J, KRepresentative SDH staining and quantification of percentage of SDH+ myofibers of TA muscles from mdx (n = 5) and ABX‐mdxFMT_C57Bl (n = 6) (n = 12 images per mouse). Scale bar: 200 μm.
-
L, MRepresentative image of CD31 (in cyan), α‐SMA (in green), and isolectin (in red) staining and their quantification in TA muscles from mdx (n = 5) and ABX‐mdxFMT_C57Bl (n = 6) mice. Scale bar: 500 μm.
Data information: Data for tetanic force, ALT and CPK concentration, and staining quantification are presented as mean ± SD (*P < 0.05, **P < 0.01, ***P < 0.001; ****P < 0.0001, one‐way ANOVA, Tukey's multiple‐comparison test).
Source data are available online for this figure.
