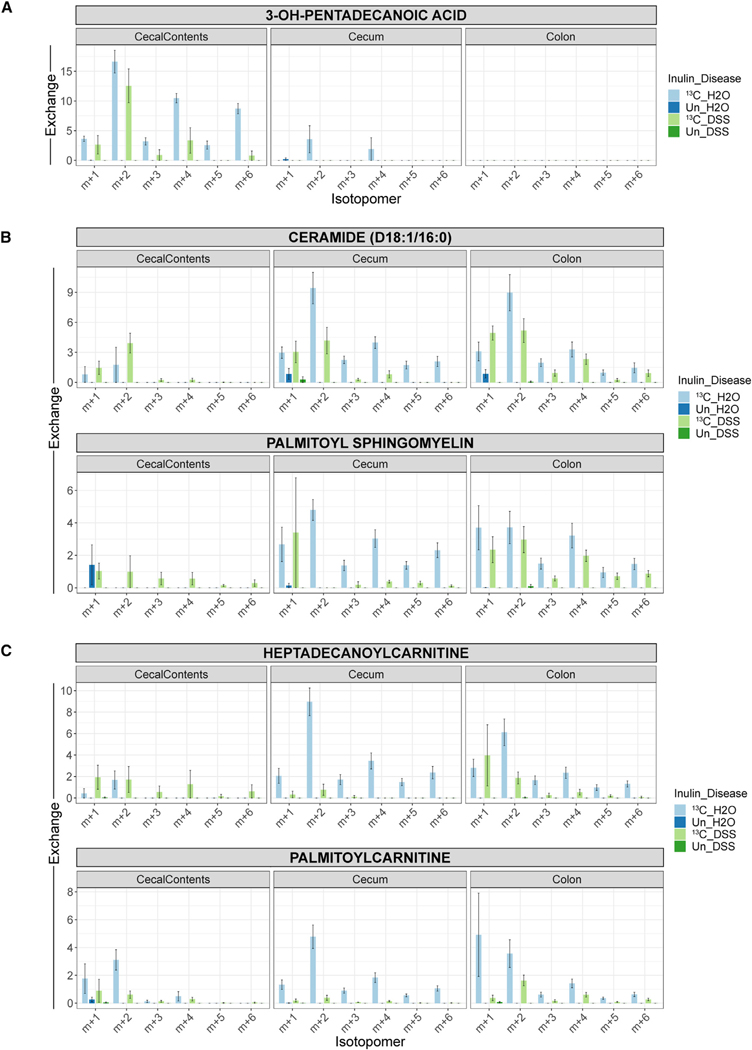
Figure 5. Inflammation interferes with the contribution of fiber to host fatty acid metabolism.
(A–C) Isotopomer distributions for metabolites with long-chain acyl groups, including LCFAs (A), membrane lipids (B), and acylcarnitines (C). Metabolites were isolated from the cecal contents, cecum, or colon. The monoisotopic peak (m + 0) and isotopomers past the m + 6 peak are omitted for clarity. The distributions are corrected for the relative abundances of naturally occurring isotopomers, meaning that unlabeled samples are expected to have no signal beyond the m + 0 peak. Mean ± SEM, n = 6. See also Figure S6.

