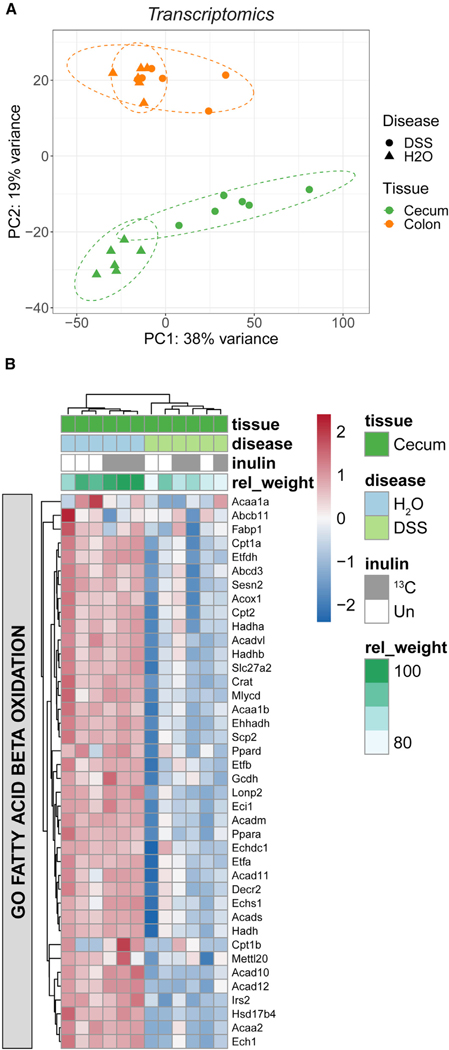
Figure 6. Inflammation suppresses cecal expression of genes supporting fatty acid metabolism.
(A) PCA of whole cecum and colon tissue based on 15,825 transcriptomic features (n = 6, three each from Un and 13C inulin groups).
(B) Heatmap of core enrichment genes related to fatty acid oxidation based on gene set enrichment analysis (GSEA) of the cecal transcriptome. The relative weight change for each mouse is also indicated at the top. See also Figure S7.

