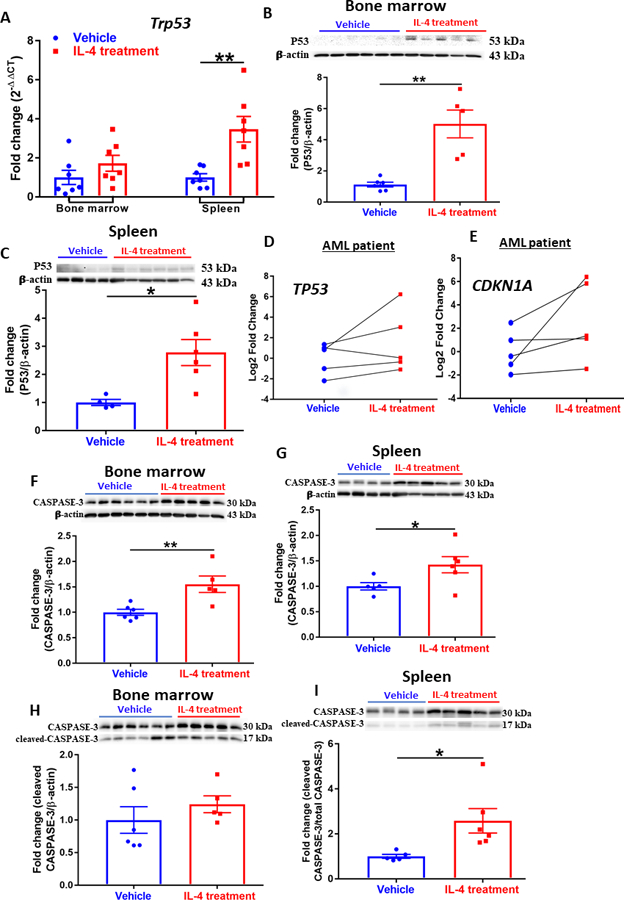
Figure 3. IL-4 administration induces apoptosis via P53 and caspase activation.

(A) Expression of Trp53 assessed by qPCR analysis in the bone marrow and spleen of AML mice. Data were normalized to 18S rRNA expression. (n=6~7). (B)(C) Western blot showing expression of P53 in cells isolated from bone marrow (B) and spleen (C) of AML mice. Densitometry was done by normalizing to vehicle control and relative to β-actin. (n=4~6). (D)(E) Expression of TP53 (D) and CDKN1A (E) assessed by qPCR analysis in patient AML cells treated with vehicle or IL-4 (n=5); each line represents a single patient sample treated with vehicle or IL-4. Data were normalized to 18S rRNA expression. (F)(G) Western blot showing expression of CASPASE-3 in cells isolated from bone marrow (F) and spleen (G) of AML mice. Densitometry was done by normalizing to vehicle control and relative to β-actin; n=4~6. (H)(I) Western blot showing expression of cleaved CASPASE-3 in cells isolated from bone marrow (H) and spleen (I) of AML mice. Densitometry was done by normalizing to vehicle control and relative to total Caspase-3; n=4~6. (A-C, F-I) Data shown are mean ± SEM per group; paired two-tailed Student t test was applied to D and E; and unpaired two-tailed Student t test was utilized for other panels; *, P < 0.05; **, P < 0.01.
