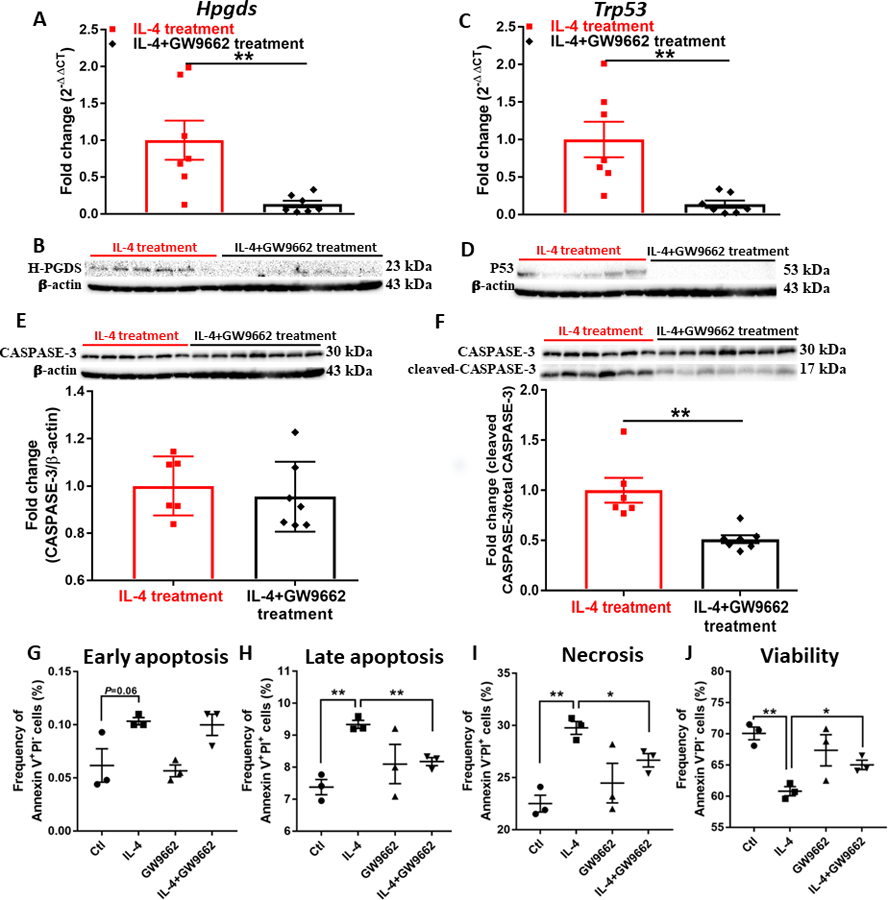
Figure 5. Antagonism of PPAR𝛄 interferes with the prostaglandin metabolism and apoptosis activated by IL-4 in AML mice.

(A)(C) Expression of Hpgds (A) and Trp53 (C) assessed by qPCR analysis in the bone marrow of AML mice. Data were normalized to 18S rRNA expression. (B)(D) Western blot showing expression of H-PGDS (B) and P53 (D) in cells isolated from bone marrow of AML mice. (E) Western blot showing expression of CASPASE-3 in cells isolated from bone marrow of AML mice. Densitometry was done by normalizing to IL-4-treated group and relative to β-actin. (F) Western blot showing expression of cleaved CASPASE-3 in cells isolated from bone marrow of AML mice. Bands were normalized to IL-4-treated group and relative to total Caspase-3. (G-J) Flow cytometric analysis of AML cells treated by 50 ng/mL IL-4 and 10 μM GW9662 for 48 h; (G) early apoptosis, (H) late apoptosis, (I) necrosis, and (J) viability were identified as Annexin V+PI−, Annexin V+PI+, Annexin V−PI+, and Annexin V−PI− fractions, respectively. Data shown are mean ± SEM per group, n=6~7 for A-F, n=3 for G-J; unpaired two-tailed Student t test was utilized; *, P < 0.05; **, P < 0.01.
