
FIGURE 5.
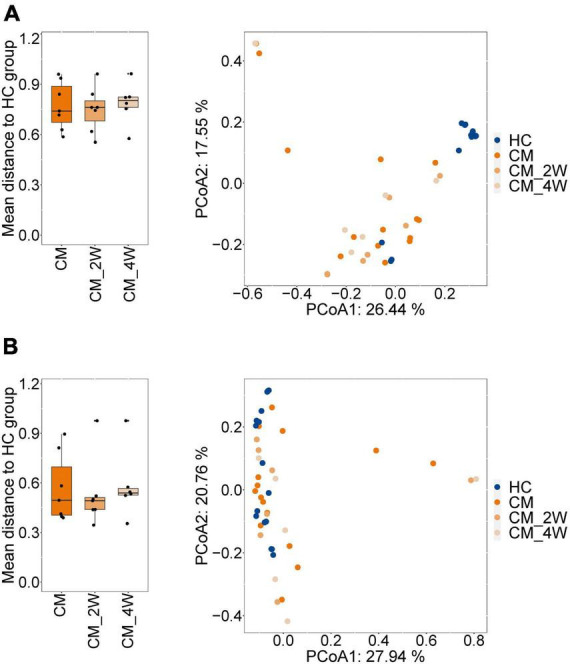
Changes of the structure and composition of fungal during treatment in CM patients. (A) Alpha diversity analysis plot at the gene level, including the number of genes, and the Shannon index. Dot plots show changes before and after treatment. Dots connected by the gray line represent individuals. (B) Principal component analysis plot based on the Bray–Curtis distance. Individuals are plotted by the same color and connected by the gray line. CM, cryptococcal meningitis; CM-2W, cryptococcal meningitis patients receiving 2 weeks of anti-fungal therapy; CM-4W, cryptococcal meningitis patients receiving 4 weeks of anti-fungal therapy.