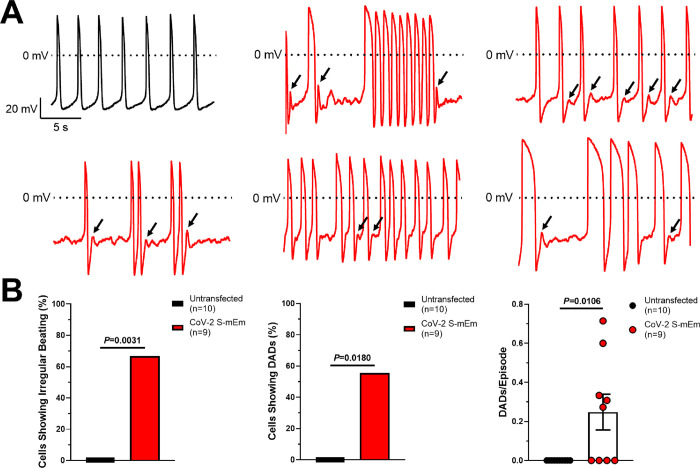
Fig 3. SARS-CoV-2 spike protein-induced hiPSC-CM syncytia display cellular arrhythmias.
(A) Representative action potential traces derived from untransfected hiPSC-CMs showing regular beating (black) and CoV-2 S-mEm-transfected hiPSC-CMs displaying erratic beating and delayed afterdepolarizations (DADs; red). Black arrows indicate individual DADs. (B) Quantification of the number of untransfected (n = 10) or CoV-2 S-mEm-transfected (n = 9) hiPSC-CMs showing irregular beating (left) or delayed afterdepolarizations (DADs; middle) as well as the rate at which DADs occur (DADs/episode; right). Graphs depicting categorical data are presented as percentage, and Fischer’s exact tests were used to determine significance. Graphs depicting continuous data are presented as mean±SEM, and unpaired two-tailed Student’s t-tests were used to determine significance.

