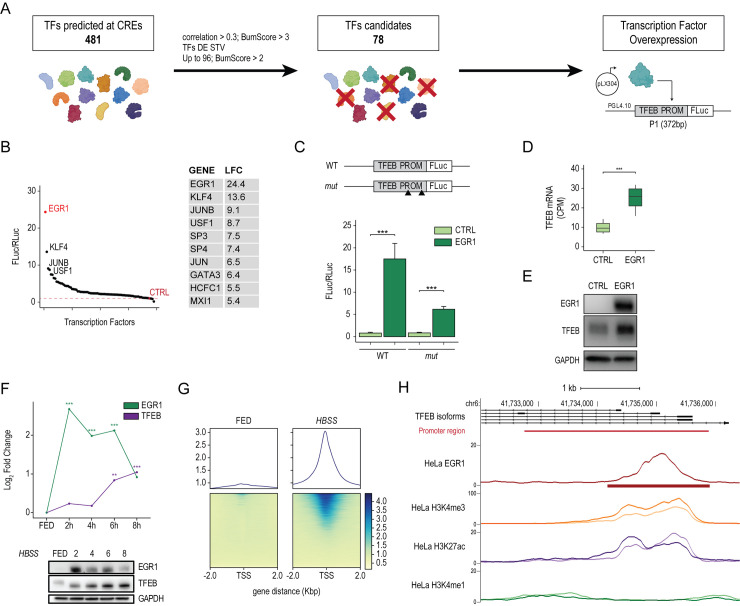
Fig 1. EGR1 positively modulates TFEB transcription.
(A) Schematic representation of the filtering strategy to identify regulators of TFEB transcription. TFs were selected according to several criteria: (i) the number of predicted binding sites at the level of the identified CREs (Bumscore >3) and their correlation of expression with TFEB (Pearson correlation >0.3); (ii) TFs differentially expressed upon starvation (TFs DE STV); (iii) TFs with a Bumscore >2 up to 96 TFs. Selected TFs were cloned in the pLX304 vector and overexpressed in HeLa cells along with the TFEB promoter-reporter (TFEB PROM), in which the TFEB promoter region was cloned upstream of the firefly luciferase reporter gene (FLuc). (B) Survey of candidate TFs through luciferase-based promoter assay. (Left) Dot plot showing the luciferase activity relative to each TF measured as FLuc/RLuc ratio shown with respect to the empty control vector (CTRL). (Right) Table of the top 10 TFs with corresponding Log FC values (LFC) relative to the ratio FLuc/RLuc. (C) TFEB promoter activity assay. TFEB promoter (WT) and its mutated version for EGR1 binding sites (mut) were cloned upstream of the firefly luciferase coding region (FLuc). These constructs were cotransfected in HeLa cells alongside plasmids expressing EGR1 open reading frame or with a control empty vector (CTRL). A construct carrying the Renilla luciferase (RLuc) was transfected as a control. Bar plot showing the luciferase activity measured as FLuc/RLuc ratio shown with respect to the control vector. Mean ± SD values are shown. ANOVA was used; *p < 0.05, **p < 0.01, ***p < 0.001. (D) Normalized expression (CPM) of TFEB mRNA in HeLa cells upon CTRL and EGR1 overexpression measured by RNAseq (*** FDR < 0.001). (E) Representative image of the immunoblot analysis of TFEB and EGR1 levels upon EGR1 overexpression in HeLa cells (n = 3). GAPDH was used as a loading control. (F) (Upper) Line plot showing EGR1 and TFEB mRNA dynamics during a starvation time course. HeLa cells were treated with HBSS for the indicated time points. EGR1 and TFEB mRNA levels were quantified by RNAseq and shown as Log2FC with respect to their levels in FED conditions (** FDR < 0.01; *** FDR < 0.001). (Lower) Representative image of immunoblot analysis of EGR1 and TFEB levels in HeLa cells treated with HBSS for the indicated time points. GAPDH was used as a loading control. (G) ChIPseq analysis of HeLa cells undergoing starvation (HBSS) for 6 hours compared to cells in fed condition (FED). (Upper) Distribution plots of the average read coverage density of EGR1 binding signal within 2 kb from all TSSs in the genome. (Lower) Binding heatmaps displaying the individual read coverage density of the EGR1 binding signal. (H) Representative genome browser snapshots of TFEB promoter bound by EGR1 in starvation. Both reads distributions as line plots and peak intervals are displayed. H3k4me3, H3k4me1, and H3K27ac enrichments at the TFEB promoter during starvation are also displayed. The genomic localization of the TFEB promoter region (as described in S1 Fig) is reported (red line). Individual quantitative observations that underlie the data summarized here can be located under the Supporting information file as S1 Data. Uncropped images can be found in the Supporting information file as S1 Raw Images. ChIPseq, chromatin immunoprecipitation sequencing; CRE, cis-regulatory element; CTRL, control; EGR1, early growth response 1; FLuc, firefly luciferase; LFC, Log FC; RLuc, Renilla luciferase; TF, transcription factor; TFEB, transcription factor EB; TSS, transcriptional start site; WT, wild-type.

