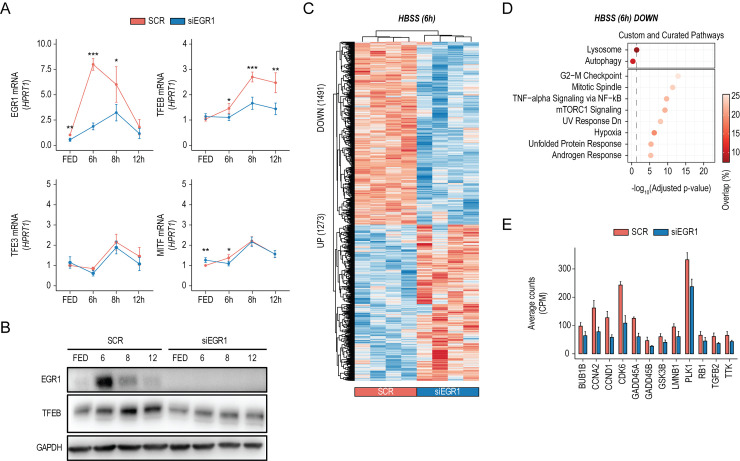
Fig 2. EGR1 depletion dampens TFEB-mediated transcriptional response to starvation.
(A) Line plots showing relative EGR1, TFEB, TFE3, and MITF mRNA levels measured by qPCR in HeLa cells treated with siRNAs targeting EGR1 (siEGR1) or scramble sequences (SCR) in fed (FED) and starved conditions for the indicated time points. Values were normalized on the HPRT expression and displayed as a fold change relative to scramble-treated samples in FED conditions set to 1. Mean ± SD values are shown. ANOVA was used; *p < 0.05, **p < 0.01, ***p < 0.001. (B) Immunoblot analysis of EGR1 and TFEB expression in HeLa cells treated with siRNAs targeting EGR1 (siEGR1) or scramble sequences (SCR) in FED conditions or during starvation for the indicated time points. GAPDH was used as a loading control. (C) Heatmap of Z-scored log2−normalized expression values of deregulated genes (UP: 1,273, DOWN: 1,491) upon siEGR1 in HeLa cells after 6 hours of starvation (HBSS 6h). Replicates for SCR and siEGR1 conditions are reported. (D) Balloon plots of representative term enrichment analysis results using Custom Genesets (Autophagy and Lysosome) and Curated Pathways (KEGG and MSigDB Hallmark collection) of down-regulated genes upon siEGR1 treatment, with respect to scramble-treated cells. Enriched terms are ranked by adjusted p-value (x-axis), and the balloon color scale represents the percentage of overlap between the input genes and the analyzed term. Significance threshold (dashed line, adjusted p-value < 0.05) is reported. (E) RNAseq-based expression (CPM) of representative genes down-regulated upon siEGR1 in HeLa. Mean ± SD values are shown. Individual quantitative observations that underlie the data summarized here can be located under the Supporting information file as S1 Data. Uncropped images can be found in the Supporting information file as S1 Raw Images. EGR1, early growth response 1; TFEB, transcription factor EB.

