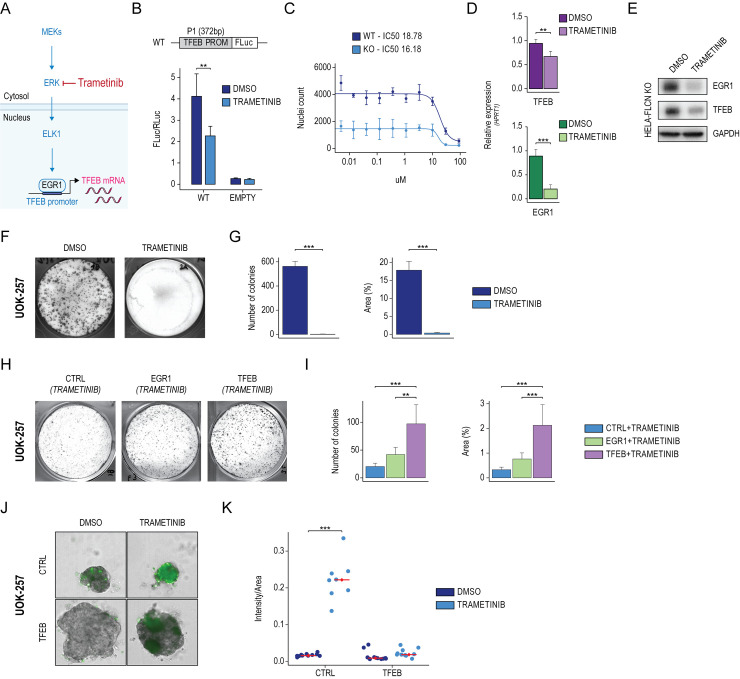
Fig 4. Trametinib inhibits the EGR1-TFEB axis in BHD patient-derived cancer cells.
(A) Schematic representation of the MEK1/2/ERK signaling cascade, which regulates EGR1 activation. (B) TFEB promoter activity assay upon Trametinib treatment. TFEB promoter (WT), along with a control vector (EMPTY), were transfected in HeLa cells for 48 hours, following starvation (HBSS) for 6 hours in the presence of DMSO or Trametinib. Bar plot showing the luciferase activity measured as FLuc/RLuc ratio. Mean ± SD values are shown. ANOVA was used; *p < 0.05, **p < 0.01, ***p < 0.001. (C) Trametinib dose–response curve. HeLa WT and HeLa-FLCN KO (KO) cells were treated with serial dilutions of Trametinib. The half maximal inhibitory concentration (IC50) was calculated by counting the nuclei of viable cells. (D) Bar plots showing relative quantification of EGR1 and TFEB mRNA levels measured by qPCR in HeLa-FLCN KO cells treated with DMSO or Trametinib. Values were normalized on the HPRT expression and displayed as a fold change relative to DMSO. Mean ± SD values are shown. ANOVA was used; *p < 0.05, **p < 0.01, ***p < 0.001. (E) Immunoblot analysis of EGR1 and TFEB expression in HeLa-FLCN KO cells treated with DMSO and Trametinib. GAPDH was used as a loading control. (F) Representative image of colony formation capacity of UOK-257 cells treated with DMSO and Trametinib. (G) Bar plots showing the quantification of colonies’ number and size (%Area) relative to indicated treatments. Mean ± SD values are shown. ANOVA was used; *p < 0.05, **p < 0.01, ***p < 0.001. (H) Representative image of colony formation capacity of UOK-257 cells transduced with control (CTRL), EGR1, and TFEB overexpression vectors and treated with Trametinib. (I) Bar plots showing the quantification of colonies’ number and size (%Area) relative to indicated treatments. Mean ± SD values are shown. ANOVA followed by Tukey’s multiple comparisons test was used; *p < 0.05, **p < 0.01, ***p < 0.001. (J) Bright-field and fluorescence representative images of 3D spheroids generated from UOK-257 cells transduced with control (CTRL) and TFEB overexpression vectors and treated with DMSO and Trametinib. (K) Dot plot showing the ratio of the intensity of the cell death dye over the size of each spheroid (Intensity/Area) derived from CTRL and TFEB-engineered UOK-257 cells upon indicated treatments. Mean ± SD values are shown. ANOVA was used; *p < 0.05, **p < 0.01, ***p < 0.001. Individual quantitative observations that underlie the data summarized here can be located under the Supporting information file as S1 Data. Uncropped images can be found in the Supporting information file as S1 Raw Images. BHD, Birt-Hogg-Dubé; CTRL, control; EGR1, early growth response 1; TFEB, transcription factor EB; WT, wild-type.

