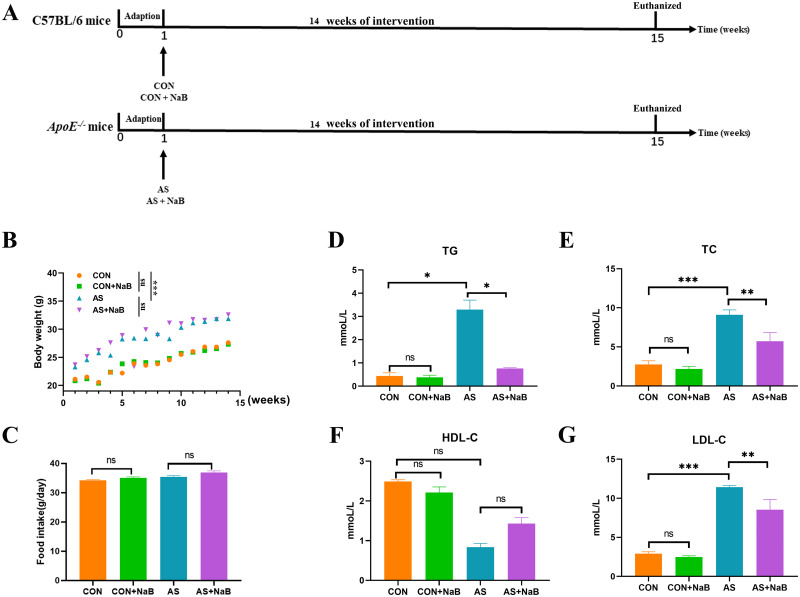
Fig 1. NaB alleviated physiological parameters and serum lipids in diverse groups.
(A) Schematic time diagram of the experimental design. (B) Body weights (BWs) of 4 groups. (C) Food intake. (D) Triglyceride (TG). (E) Total cholesterol (TC). (F) High-density lipoprotein (HDL-C). (G) Low-density lipoprotein (LDL-C). Data were expressed as mean ± SEM. *P<0.05, **P<0.01, ***P<0.001. ns, no significant difference. CON: control group; CON+NaB: sodium butyrate (NaB)-fed control group; AS: model group; AS+NaB: NaB-fed model group.

