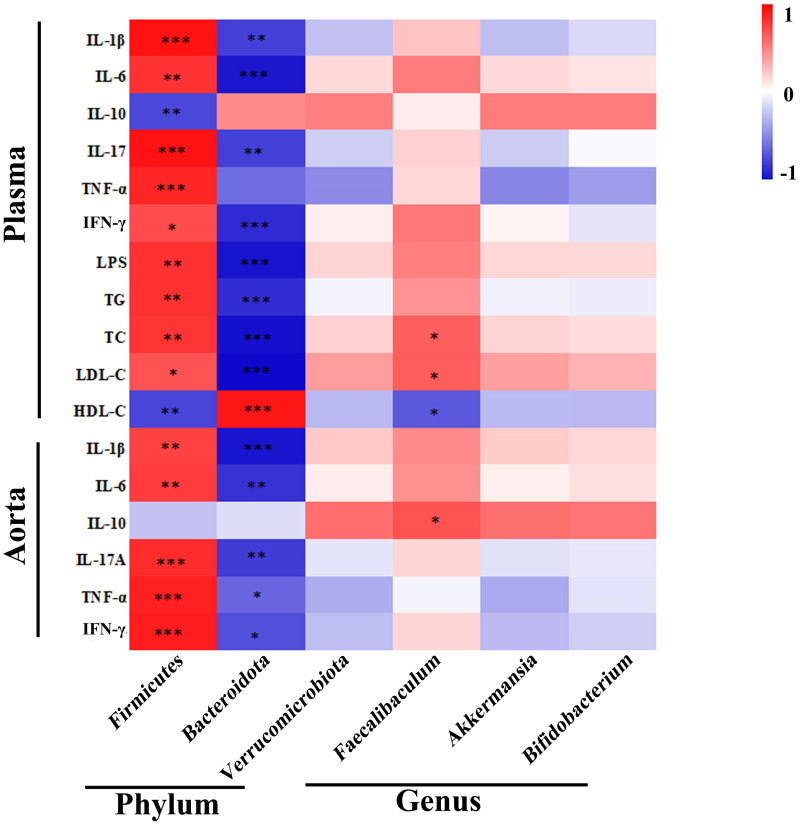
Fig 7. Altered gut microbiota in AS mice and their association with inflammatory indicators and serum lipids.
The heat map showing the correlation of different microbial abundance with inflammatory indicators and serum lipids. The intensity of the color indicates the degree of correlation between the corresponding factor and each microbial species, which is obtained by Spearman’s correlation analysis. *P<0.05, **P<0.01, ***P<0.001.

