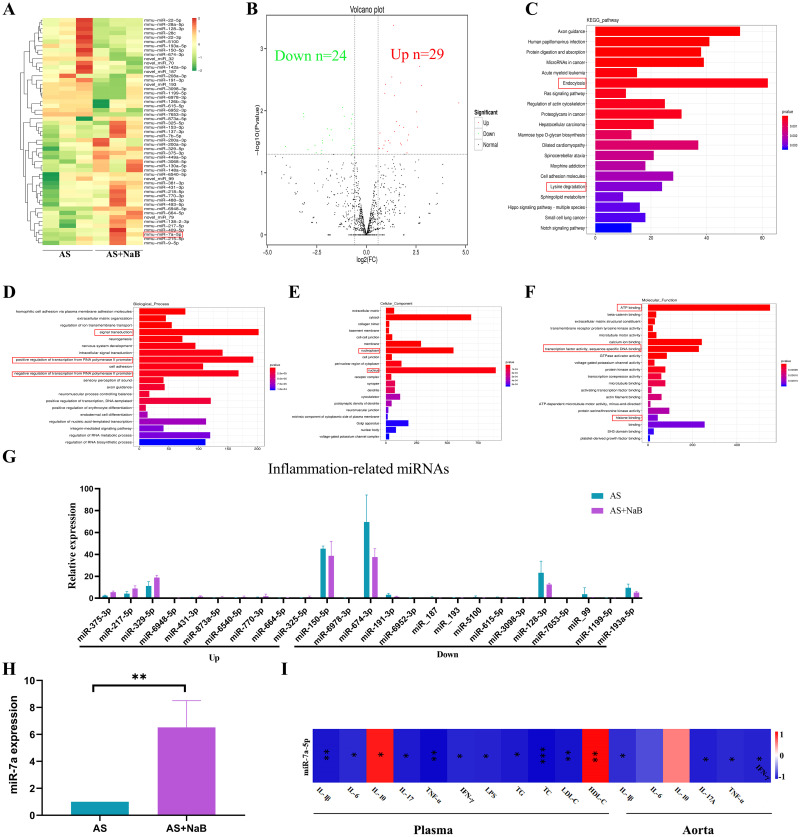
Fig 8. NaB altered the aorta transcriptome.
(A) MiRNAs cluster heatmap with differential expression in AS and AS+NaB groups. (B) Differential-expression volcano diagram. (C) KEGG enrichment plot of differential miRNA host genes between AS and AS+NaB. (D-F) GO analysis of miRNA host genes between AS and AS+NaB. (G) Inflammation-related miRNAs. (H) The expression level of miR7a-5p was measured by real-time PCR. (I) Correlation analyses between the relative abundance of miR7a-5p and other related indicators. *P<0.05, **P<0.01, ***P<0.001. ns, no significant difference.

