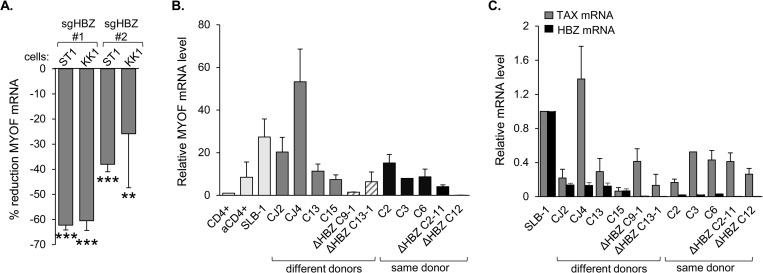
Fig 2. Expression of HBZ correlates with MyoF expression.
(A) Deletion of HBZ in ST1 and KK1 ATL cells reduces MYOF expression. The graph was generated from published microarray data (GEO accession number GSE94409 [56]) and shows the percent reduction in MYOF transcript levels seven days after inducing CRISPR/Cas9-mediated knockout of HBZ in the ATL cell lines, ST1 and KK1, using two different guide RNAs (sgHBZ #1 and #2) compared to the guide RNA control. Data were obtained using GEO2R with calculations based on averaged values from the three array features probing for different regions of the MyoF transcript; ** p<0.01, *** p<0.001. (B) Relative MYOF mRNA levels in HTLV-1-immortalized human T-cell clones recently established from peripheral blood lymphocytes (PBL). The graph shows qRT-PCR results as follows: C3, value from one RNA extraction; ΔHBZ clones, values averaged from two extractions; all others, values averaged from three extractions. Values were normalized to those for the resting CD4+ T-cells (set to 1). Dark gray bars show clones derived from different PBL donors immortalized with HTLV-1-wt (CJ2, CJ4, C13, C15). Hatched bars show clones derived from different PBL donors immortalized with HTLV-1-ΔHBZ (C9-1 and C13-1). Black bars show clones immortalized with either HTLV-1-wt or HTLV-1-ΔHBZ derived from the same PBL donor (C2, C3, C6, C2-11 and C12). Light gray bars show a subset of cells also analyzed in Fig 1C for comparison. (C) Relative tax and hbz mRNA levels in HTLV-1-immortalized human T-cell clones recently established from PBL. The graph shows qRT-PCR results averaged from the same set of RNA specimens analyzed in (B) in which values were normalized to those for the SLB-1 T-cells (set to 1).

