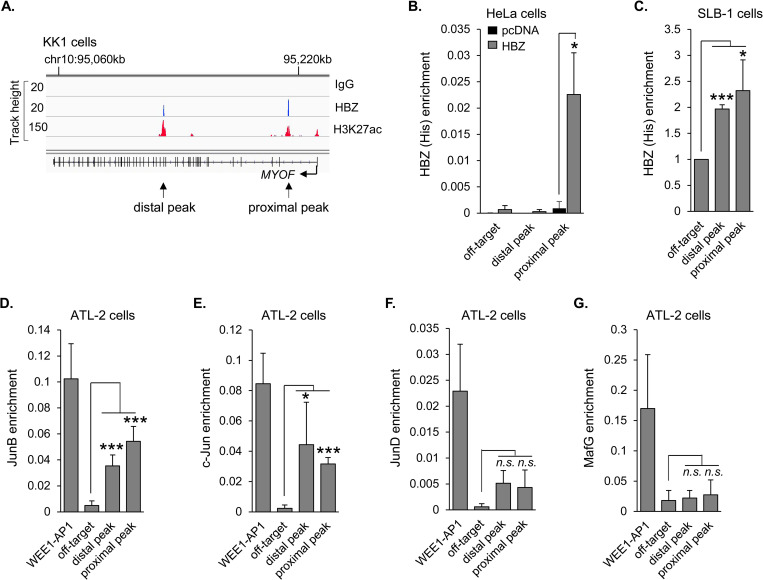
Fig 3. HBZ binds the MYOF gene in conjunction with c-Jun and JunB.
(A) HBZ binds to two sites within the MYOF gene in the ATL cell line, KK1. Peaks of enrichment for HBZ, the epigenetic mark, H3K27ac, and control (IgG) at the MYOF locus in KK1 cells are shown in the IGV Browser. Genomic coordinates are based on the NCBI36/hg18 assembly. Data were obtained from published ChIP-Seq data sets (GEO accession number GSE94732 [56]). (B) HBZ binds to the proximal peak in HeLa cells. The graph shows average values from three independent ChIP assays using empty vector (pcDNA) and HBZ (6x His C-terminal tag)-expressing HeLa cells. Shown are levels of HBZ-enrichment at the off-target site (1,796 bp from the end of the gene) and at the distal and proximal peaks with respect to the TSS; * p<0.05. (C) HBZ binds the distal and proximal peaks in SLB-1 cells. The graph shows fold enrichment relative to that for the off-target site (set to 1) averaged from three independent ChIP assays using SLB-1 cells transduced to express HBZ with a C-terminal 6x His tag; * p<0.05, *** p<0.001. (D) and (E) JunB and c-Jun are enriched at the distal and proximal peaks in ATL-2 cells. (F) and (G) JunD and MafG are not enriched at the HBZ-binding peaks. Graphs show average values from five (D and E) to three (F and G) independent ChIP assays using ATL-2 cells; * p<0.05, *** p<0.001, n.s: non-significant. Factor-enrichment was analyzed at the off-target site, the distal and proximal MYOF peaks, and at the AP1 site in the WEE1 promoter (WEE1-AP1).

