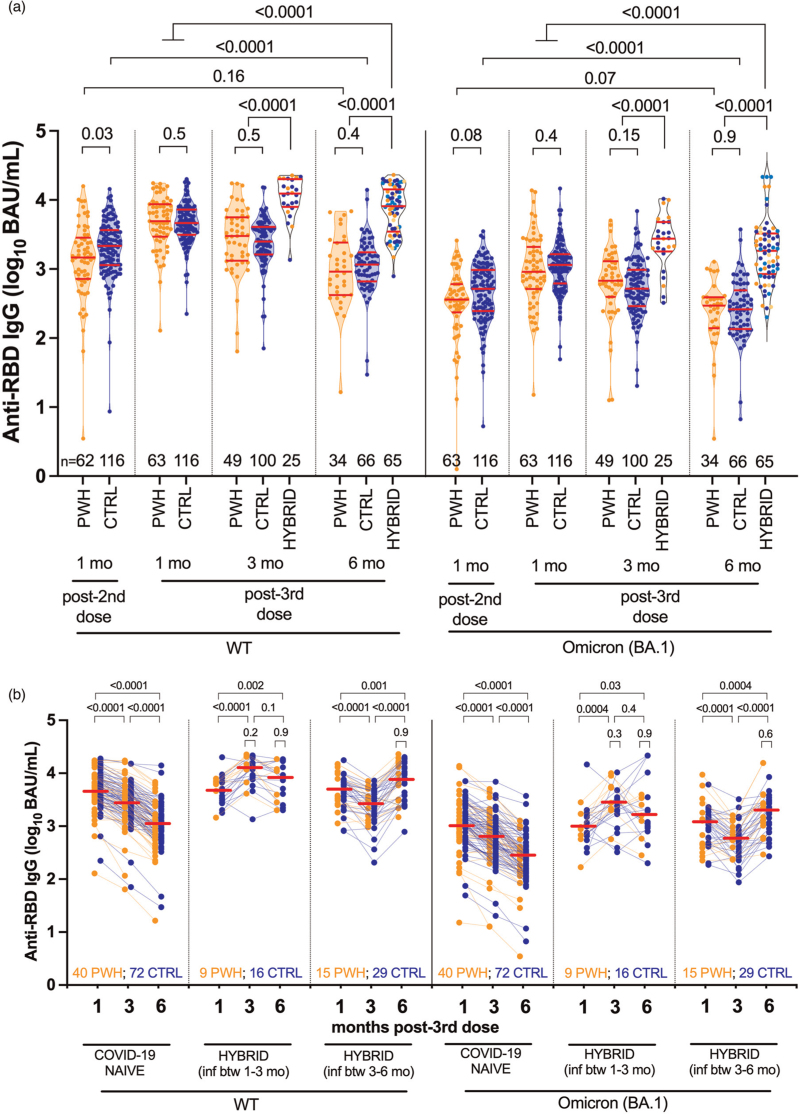
Fig. 1.
Wild-type-specific and Omicron BA.1-specific anti-RBD IgG concentrations following three-dose coronavirus disease 2019 vaccination.
Panel a: longitudinal serum anti-RBD IgG concentrations specific to wild-type (left side) and Omicron BA.1 (right side) in COVID-19-naive people with HIV (PWH; orange circles) and controls (CTRL; blue circles). Any participant who experienced a SARS-CoV-2 breakthrough infection between 1 and 3, or 3 and 6 months post-third dose was reclassified into the ‘hybrid’ group at their subsequent study visit, with PWH in orange and CTRL in blue circles. At 6 months post-third dose, the darker colored symbols in the hybrid group denote recent infections that occurred between 3 and 6 months, while the lighter colored symbols denote the infections that had previously occurred between 1 and 3 months. Red bars indicate median and IQR. Comparisons between independent groups were performed using the Mann–Whitney U test; longitudinal paired comparisons were performed using the Wilcoxon matched pairs test. P values are not corrected for multiple comparisons. Panel b: same data as panel a, but where serum anti-RBD IgG concentrations are plotted longitudinally by participant (PWH in orange, CTRL in blue). Participants are stratified into three groups: those who remained COVID-19-naive throughout the study, those who experienced a SARS-CoV-2 breakthrough infection between 1 and 3 months post-third dose, those who experienced a SARS-CoV-2 breakthrough infection between 3 and 6 months post-third dose. Horizontal red lines denote the overall median response at each time point, where PWH and CTRL are treated as a combined group. P values above larger brackets compare responses between time points using the Wilcoxon matched pairs test, again where PWH and CTRL are treated as a combined group. In contrast, the P values above the small brackets compare responses between PWH and CTRL with hybrid immunity, at each time point post-SARS-CoV-2 infection, using the Mann–Whitney U test. P values are not corrected for multiple comparisons.

