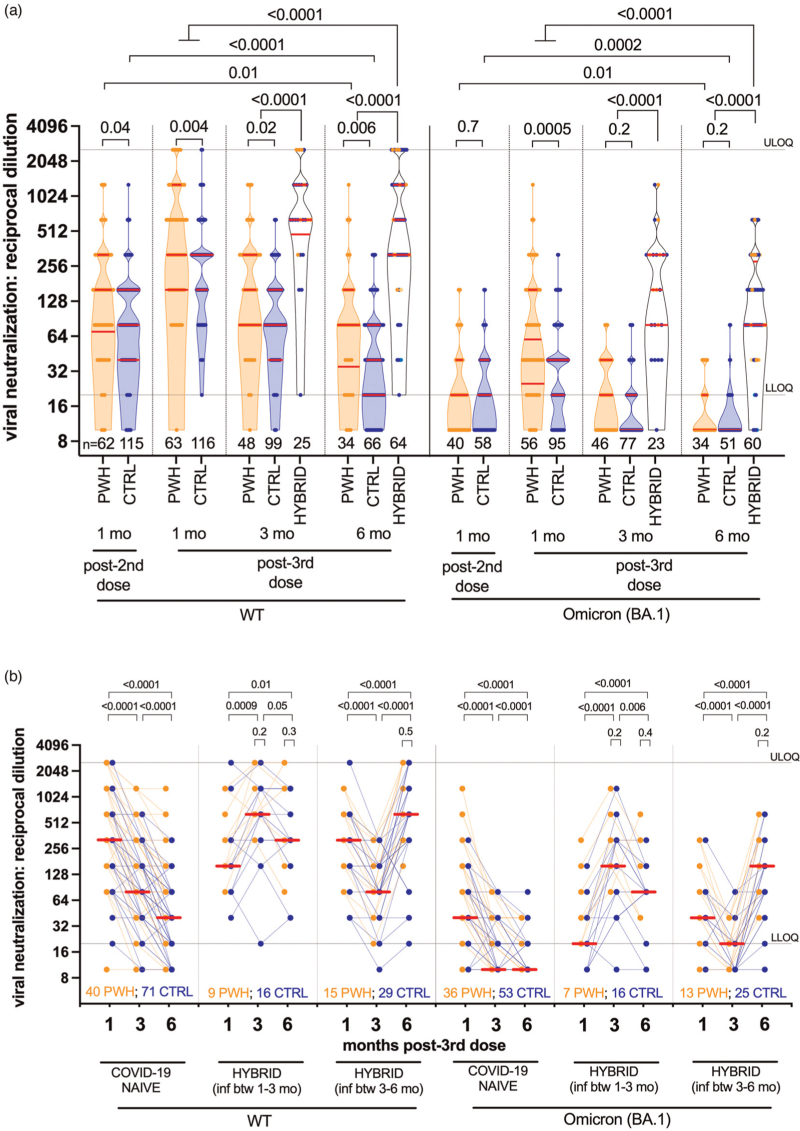
Fig. 3.
Wild-type-specific and Omicron BA.1-specific live virus neutralization activity following three-dose coronavirus disease 2019 vaccination.
Panel a: same as Fig. 1a, but for live virus neutralization activity, defined as the highest reciprocal plasma dilution at which neutralization was observed in all wells of a triplicate assay. Serial two-fold dilutions of 1/20 (lower limit of quantification; LLOQ) to 1/2560 (upper limit of quantification; ULOQ) were tested. Plasma samples showing neutralization in fewer than three wells at a 1/20 dilution are displayed as a reciprocal dilution of ‘10’ and were reported as below limit of quantification (BLOQ) in the text. Omicron BA.1-specific neutralization was performed on a subset of samples only. Panel b: same data as panel a, but where neutralization activities are plotted longitudinally by participant (PWH in orange, CTRL in blue). The legend is the same as for Fig. 1b. Note that many data points are superimposed in both panels.

