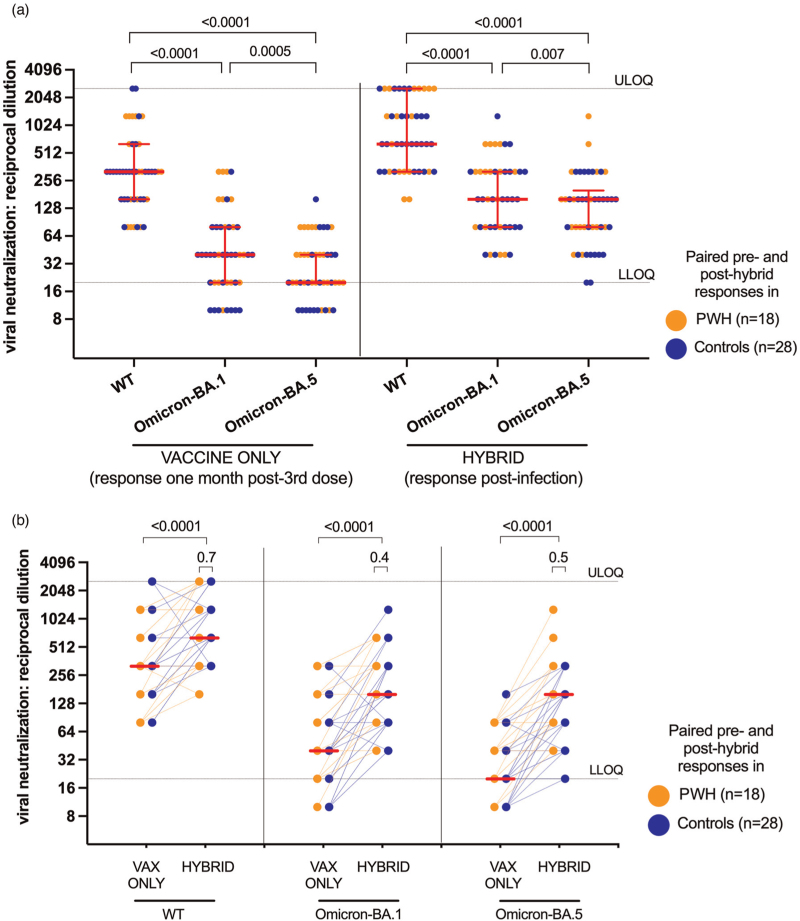
Fig. 4.
Wild-type-specific, Omicron BA.1-specific and Omicron BA.5-specific live virus neutralization activity before and after breakthrough infection.
Panel a: wild-type-specific, Omicron BA.1-specific and Omicron BA.5-specific neutralization activities in 18 PWH (orange circles) and 28 CTRL (blue circles) 1 month after the third vaccine dose (’vaccine only’) and after subsequent SARS-CoV-2 infection (’hybrid’). In this panel, data are plotted to facilitate comparisons between variant-specific neutralization activities, before and after breakthrough infection. P values, computed on PWH and CTRL as a combined group, were computed using the Wilcoxon matched pairs test. P values are not corrected for multiple comparisons. ULOQ/LLOQ: upper/lower limit of quantification. Panel b: same data as in panel a but plotted longitudinally by participant to highlight the impact of breakthrough infection on neutralization activity. Red lines indicate medians of PWH and CTRL as a combined group. P values on top of large brackets compare paired responses before and after breakthrough infection using the Wilcoxon matched pairs test. In contrast, the P values above the small brackets compare responses between PWH and CTRL at the post-infection time point using the Mann–Whitney U test. Note that a large number of points are superimposed in this plot.

