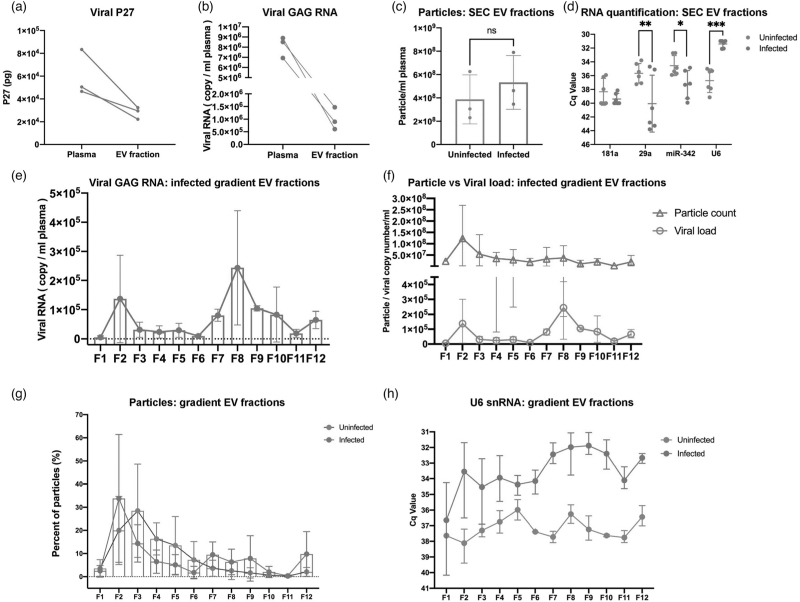
Fig. 5.
EV and EV small RNA characterization in iodixanol density fractions.
SIV P27 GAG protein (a) measured by ELISA and GAG RNA and (b) by qPCR in raw plasma and EV-enriched SEC fraction from SIV acutely infected pigtailed macaque plasma (n = 3). (c) Particle concentrations of EV-enriched SEC fractions of uninfected (n = 3) and acutely infected (n = 3) pigtailed macaques as measured by HSFCM. Particle concentration for each group was normalized by plasma input (per 1 ml). ns, no significant difference (P > 0.05) by two-tailed t-test. (d) qPCR validation for miRNAs and U6 snRNA in EV-enriched SEC fractions from uninfected and acutely infected plasma. ∗P ≤ 0.05, ∗∗P ≤ 0.01, ∗∗∗P ≤ 0.001, ∗∗∗∗P ≤ 0.0001 by two-tailed t-test. (e) GAG RNA level detected by qPCR in 12 EV fractions separated by iodixanol density gradient in acutely infected plasma (n = 3). (f) EV particle concentration and SIV GAG RNA copy number were plotted for 12 EV iodixanol fractions of acutely infected plasma (n = 3). Particle concentration and viral RNA copy number for each group was normalized by plasma input (per 1 ml). (g) Particle number distribution of 12 iodixanol fractions from uninfected (n = 3) and acutely infected plasma (n = 3). Particle concentration for each fraction was measured by HSFCM and calculated as particles in each fraction versus total particles recovered from 12 fractions (percentage). (h) The level of U6 in 12 iodixanol fractions from uninfected (n = 3) and acute infected plasma (n = 3). (a)–(h) Data are mean ± SD.

