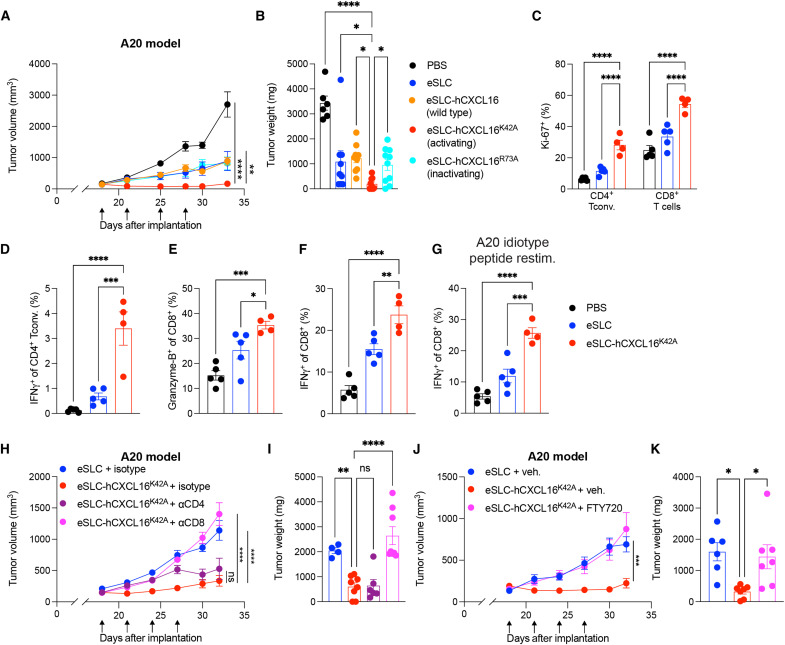
Fig. 2. Activating hCXCL16K42A strain promotes tumor regression in a subcutaneous murine B cell lymphoma model.
(A and B) Subcutaneous A20 tumor growth curves and weights from BALB/c mice (n = 5 per group) that received intratumoral injections (black arrows) with the indicated treatment. Representative of three independent experiments [*P < 0.05, **P < 0.01, and ****P < 0.0001, (A) two-way ANOVA with Holm-Sidak post hoc test; (B) one-way ANOVA with Holm-Sidak post hoc test]. (C to G) Flow cytometric analysis of tumor-infiltrating lymphocytes from subcutaneous A20 tumors (n ≥ 4 per group) following the indicated treatment. (C) Frequencies of Ki-67+CD4+Foxp3− and Ki-67+CD8+ T cells. (D) Frequencies of IFN-γ+CD4+Foxp3− T cells following PMA/ionomycin ex vivo restimulation. (E) Frequencies of Granzyme-B+CD8+ T cells. (F and G) Frequencies of IFN-γ+CD8+ T cells following ex vivo restimulation with (F) PMA/ionomycin and (G) MHC-I–restricted A20 idiotype peptide. Data are representative of three independent experiments. *P < 0.05, **P < 0.01, ***P < 0.001, and ****P < 0.0001, (C) two-way ANOVA with Holm-Sidak post hoc test and (D to G) one-way ANOVA with Holm-Sidak post hoc test. (H and I) A20 tumor growth curves and weights (n = 5 mice per group) with indicated intratumoral bacterial injections and intraperitoneal injections of the indicated antibody. **P < 0.01 and ****P < 0.0001, (H) two-way ANOVA with Holm-Sidak post hoc test; (I) ****P < 0.0001, one-way ANOVA with Holm-Sidak post hoc test. (J and K) A20 tumor growth curves and weights (n = 3 to 4 mice per group) that received intratumoral treatment and daily administration of vehicle or FTY720, as indicated. (J) ***P < 0.001, two-way ANOVA with Holm-Sidak post hoc test; (K) *P < 0.01, one-way ANOVA with Holm-Sidak post hoc test. Data are displayed as means ± SEM. Tconv, conventional T cells; ns, not significant.

