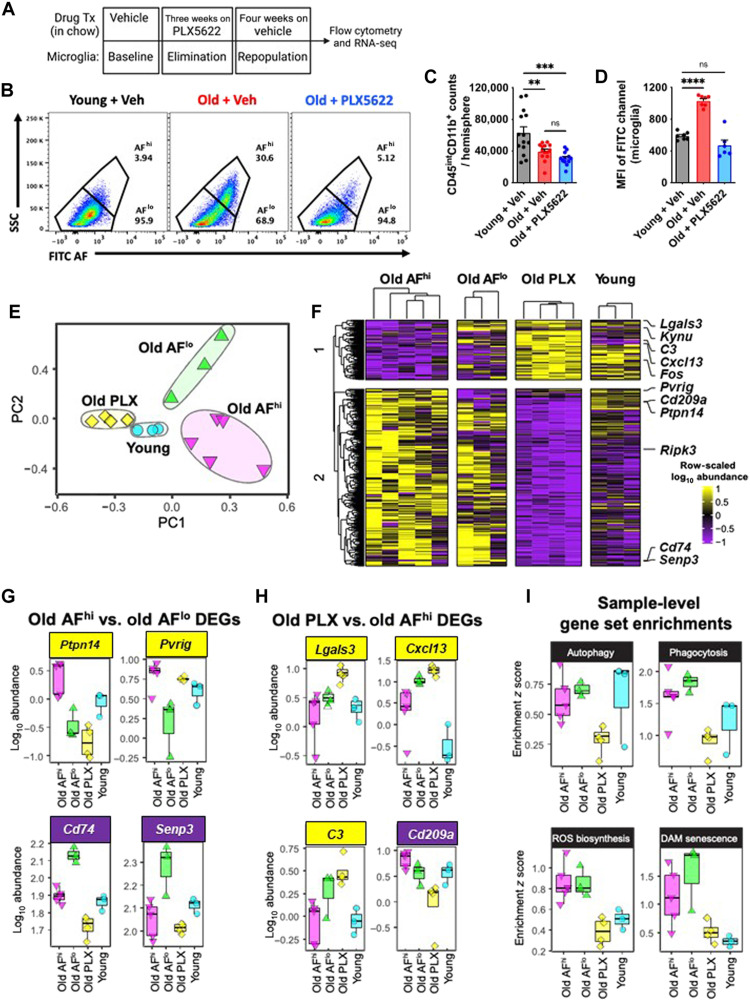
Fig. 3. Transcriptomic signature of old, AF microglia is partially rejuvenated following elimination and 4 weeks of repopulation.
(A) Timeline of experimental design for the acute 4-week microglial repopulation period is shown. Tx, treatment. (B) A representative dot plot depicts the subsets and group conditions of FACS-sorted microglia that were evaluated downstream by RNA-seq. After 4 weeks of repopulation, the (C) number of microglia and (D) MFI in the FITC channel (i.e., relative autofluorescence) was measured. (E) PCA plot of whole transcriptomes for each microglial subset/group is shown. (F) Heatmap showing DEGs (false discovery rate < 0.1) comparing old AFhi versus old AFlo, or old PLX5622 (PLX) versus old AFhi. Expression is shown as row-scaled log10 abundance. Select top-ranked DEGs from (G) old AFhi versus old AFlo and (H) old PLX5622 versus old AFhi comparisons. (I) Expression of gene sets for key functional pathways were analyzed using SLEA. Samples were z-scored on the basis of expression of selected gene sets compared to a sample-specific null distribution. ns, not significant. Data are represented from two independent experiments (N = 6 to 8 mice per group). Data (C and D) were analyzed using one-way ANOVA with Bonferroni post hoc correction for multiple comparisons (**P < 0.01, ***P < 0.001, and ****P < 0.0001).

