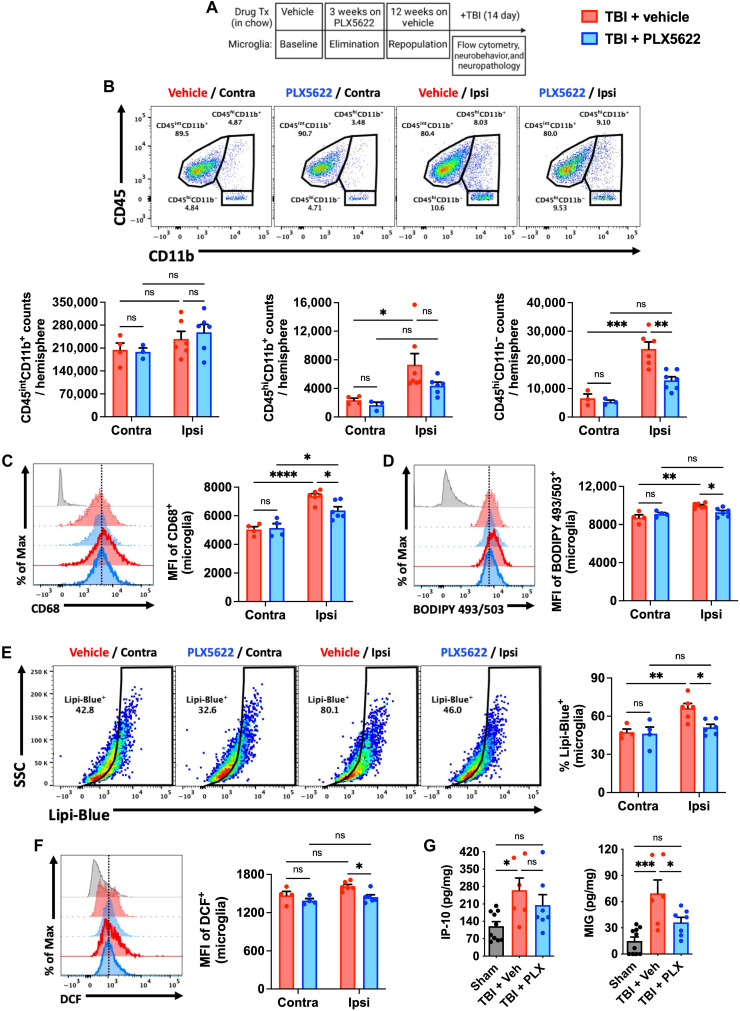
Fig. 7. Forced turnover of microglia in aged mice reduces chronic inflammation and emergence of the AF-related phenotype after TBI.
(A) Timeline of experimental design immediately before sham and TBI surgery. (B) Representative dot plots of immune populations in the ipsilateral and contralateral (internal control) brain hemispheres at 2 weeks after TBI. Quantification of CD45intCD11b+ microglia (left), infiltrating CD45hiCD11b+ myeloid (center), and CD45hiCD11b− lymphocyte (right) counts per hemisphere is shown for aged, injury, and treatment groups. (C) A representative histogram of CD68+ microglia is shown next to the MFI quantification of this phagocytosis marker. (D) A representative histogram shows the relative level of neutral lipids in microglia from each hemisphere after TBI. (E) Representative dot plots depict the percentage of Lipi-Blue+ microglia after TBI. The frequency of lipid droplet–containing microglia is quantified. (F) A representative histogram shows the relative level of ROS production in microglia as measured by DCF probe. (G) Cytokine protein concentrations in the peri-lesional cortex as measured by ELISA. No differences were seen between sham control groups after treatment, and so data for both sham groups were combined. N = 3 to 4 per contralateral and 6 to 7 per ipsilateral (i.e., TBI) group. FMO controls are shown in gray, contralateral groups are shown with no outline, ipsilateral groups are shown with bold outlines, and treatment groups are color-coded according to bar graph and figure legend (TBI + Veh in red and TBI + PLX5622 in blue). Contra, contralateral; Ipsi, ipsilateral; ns, not significant.. Data were analyzed using two-way ANOVA with Tukey post hoc correction (B to F) and one-way ANOVA with Bonferroni post hoc correction (G) for multiple comparisons (*P < 0.05, **P < 0.01, ***P < 0.001, and ****P < 0.0001).

