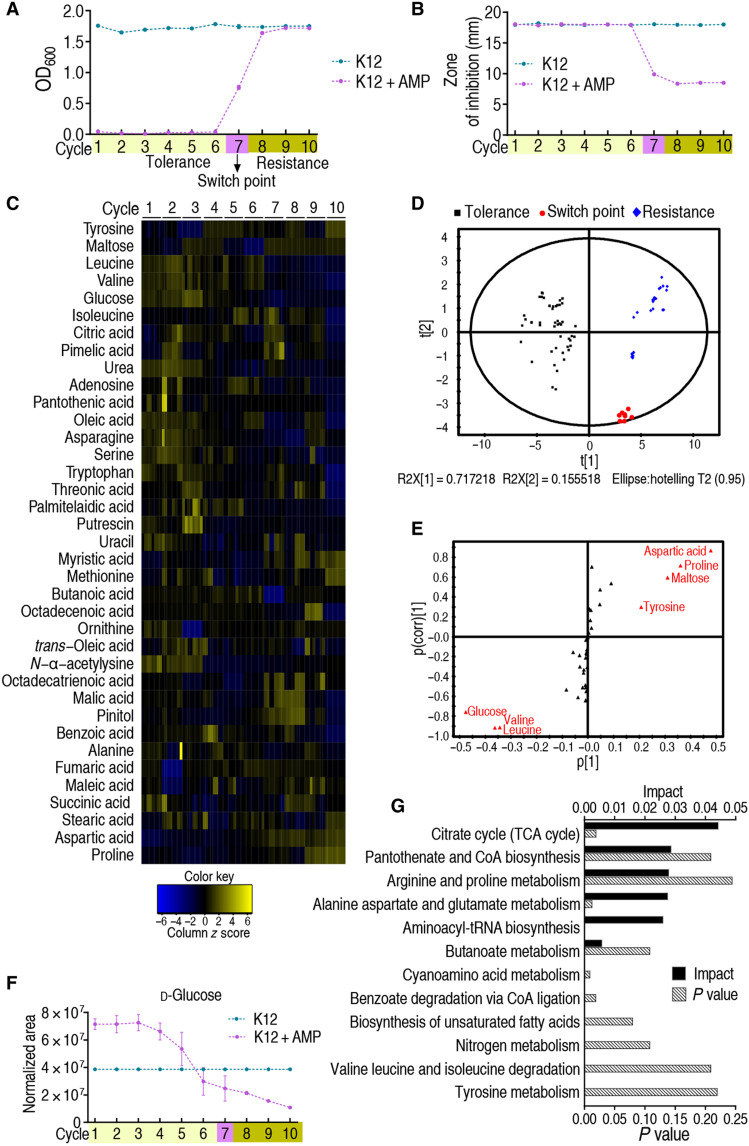
Fig. 1. Metabolomic analyses of E. coli K12 during cycles of intermittent daily exposure to ampicillin.
(A) K12 (n = 4) was cultured in growth medium with or without ampicillin (AMP; 100 μg/ml) for 4.5 hours at 37°C followed by 16 hours in growth medium with or without AMP (0.625 μg/ml), respectively, per day for 10 days/cycles. Cell density/survival after each cycle was measured. Switch point occurs four times and one time in the seventh and sixth cycles, respectively, in five independent experiments. (B) Cells cultured as in (A) were collected at the end of every cycle for MIC by an Oxford cup (n = 4). Results are displayed as means ± SEM. Each experiment was repeated independently at least three times. (C) Cells were also collected for GC-MS analysis. The abundance of 63 metabolites was quantified and presented graphically as a heatmap. Blue and yellow correspond to low to high abundance. See Materials and Methods for details. (D) Principal components analysis of data in (C). Each dot represents one technical replicate. (E) S-plot generated from OPLS-DA. Predictive component p[1] and correlation p(corr)[1] differentiate tolerance from resistance. Each triangle represents a single metabolite. Putative biomarkers (red) based on cutoff of ≥0.05 absolute value of covariance p and ≥0.5 correlation p(corr). (F) Abundance of the putative biomarker glucose as a function of increasing tolerance/resistance to AMP, as shown in (A). (G) Pathway analysis of differential metabolites identified in (C).

