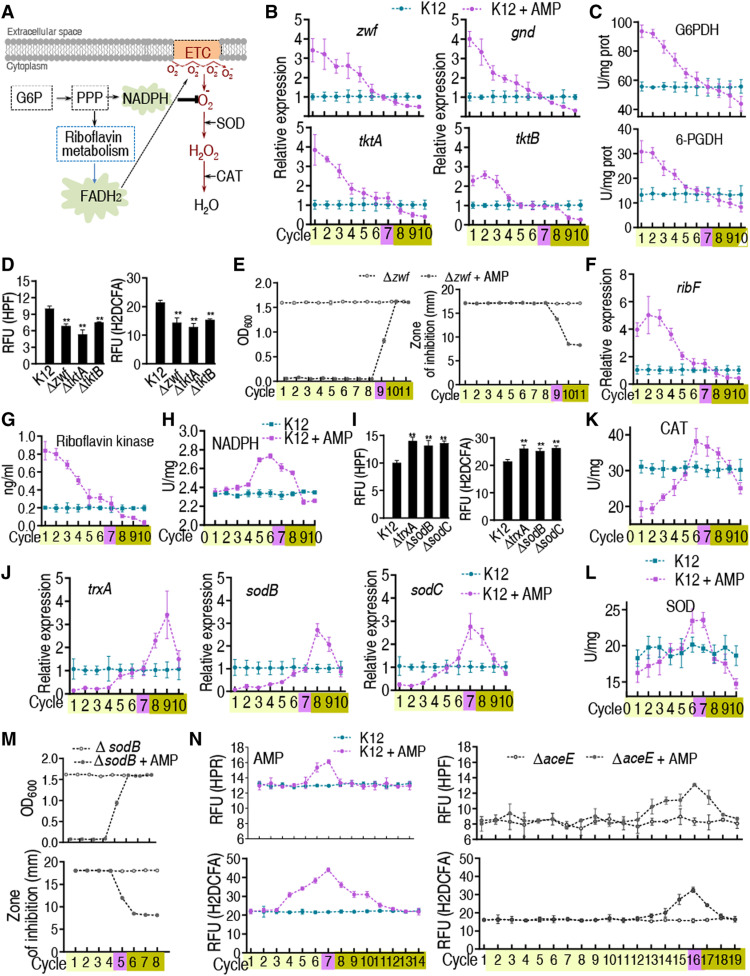
Fig. 4. Gene expression of PPP and ROS abundance at cycles exposed to AMP in bacteria.
K12, ∆aceE, or other mutant cells were cultured and collected as in Fig. 1. (A) ROS generation during oxidative phosphorylation via PPP. (B) Gene expression of zwf, gnd, tktA, and tktB of PPP in cycles (n = 4). (C) Activity of G6PDH and 6-PGDH in the evolutionary cycle (n = 4). (D) ROS in the indicated mutants (n = 3). (E) Growth/viability and MIC of the E. coli K12 ∆zwf after the indicated number of cycles exposed to AMP (n = 4). (F) Gene expression of ribF in the evolutional cycle (n = 4). (G) Activity of riboflavin kinase in the cycles (n = 4). (H) NADPH content in the cycles (n = 4). (I) ROS in the indicated mutants (n = 3). (J) Gene expression of antioxidant reactive pathways in the cycles (n = 4). (K and L) Activity of CAT (K) and SOD (L) of K12 in the cycles (n = 4). (M) Growth/viability and MIC of the E. coli K12 ∆sodB were estimated from OD600 after the indicated number of cycles of exposure to AMP (n = 4). (N) ROS of K12 and ∆aceE in the cycles (n = 4). Results are displayed as means ± SEM, and statistically significant differences are identified by Kruskal-Wallis followed by Dunn’s multiple comparison post hoc test unless otherwise indicated. **P < 0.01.

