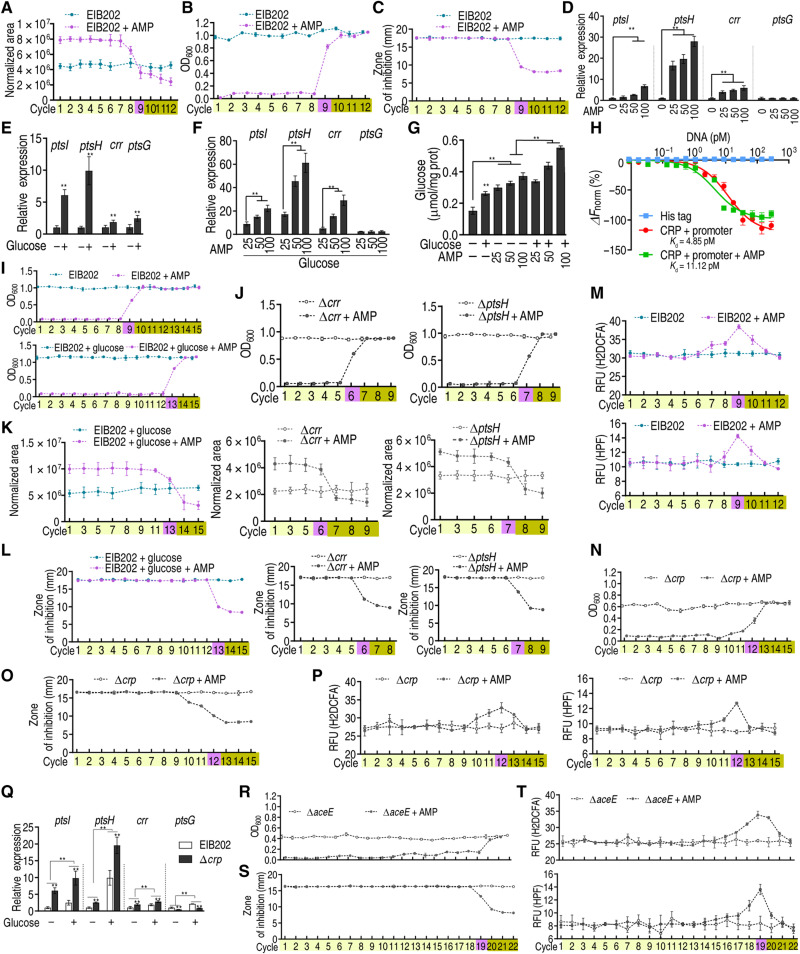
Fig. 8. AMP-PTS/PDH-glucose-cAMP/CRP-ROS regulatory cascade in E. tarda.
EIB202, EIB202 ∆crp, or EIB202 ∆aceE cells were treated as in Fig. 1. (A to C) Glucose (A), cell density/survival (B), and MIC (C) of EIB202 (n = 4) were measured after each cycle. (D to F) Gene expression of ptsI, ptsH, crr, and ptsG at the indicated AMP concentration (D), 4 mM glucose (E), or 4 mM glucose plus AMP (F) (n = 3). (G) Intracellular glucose level in the presence of 4 mM glucose or/and indicated AMP concentrations (n = 3). (H) MST for the binding of CRP with promoter in the presence of AMP (n = 3). (I and J) Growth/viability of EIB202 (I) and ∆crr and ∆ptsH (J) was measured after the indicated number of cycles exposed to AMP (n = 4). (K and L) Glucose concentration (K) and MIC (L) on data (I and K) (n = 4). (M) ROS abundance in EIB202 with AMP (n = 4). (N to P) Cell density/survival (N), MIC (O), and ROS abundance (P) of ∆crp after each cycle (n = 4). (Q) Gene expression of ptsI, ptsH, crr, and ptsG exposed to 4 mM glucose in EIB202 and ∆crp (n = 3). (R to T) Cell density/survival (R), MIC (S), and ROS abundance (T) of ∆aceE after each cycle (n = 4). Results are displayed as means ± SEM, and statistically significant differences are identified by Kruskal-Wallis followed by Dunn’s multiple comparison post hoc test for all the tests unless otherwise indicated. **P < 0.01.

