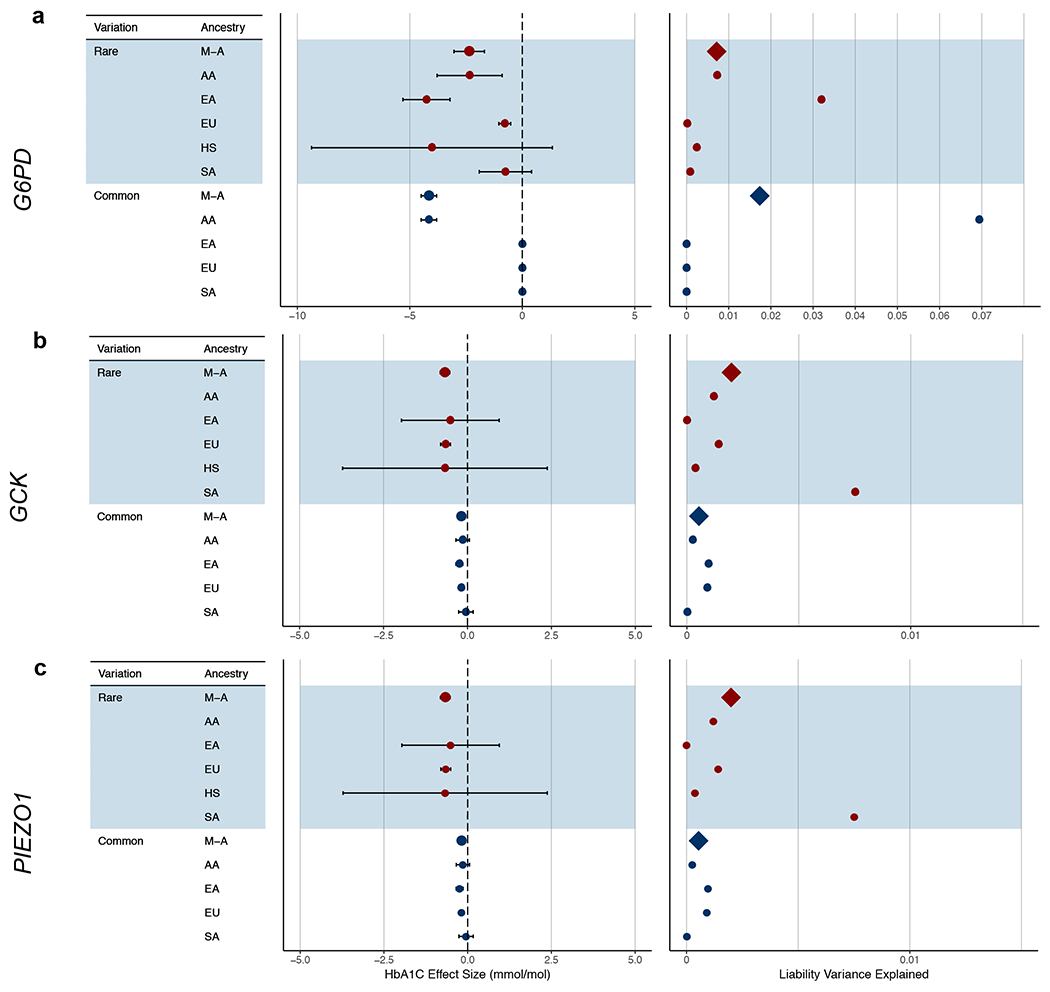
Extended Data Figure 2 |. Effect sizes and proportion of variance explained for rare variant HbA1C gene-level associations.

Results are displayed for a, G6PD (N=1,382 for AA; N=1,930 for EA; N=41,689 for EU; N=1,861 for SA; N=892 for HS), b, GCK (N=551 for EA; N=40,241 for EU; N=487 for HS), and (c) PIEZO1 (N=905 for AA; N=1,340 for EA; N=42,061 for EU; N=789 for SA; N=484 for HS). We calculated effect sizes (mmol/mol) and liability variance explained separately for each ancestry and then combined these via a meta-analysis. We performed the calculations for the strongest associated gene-level mask and for the strongest associated common variant within 125kb of the gene as previously reported7 (N=7,564 for AA; N=20,838 for EA; N=123,665 for EU; N=8,874 for SA). Proportion of variance explained is displayed as the proportion of total liability variance. Abbreviations: AA, African-American; EA, East Asian; EU, European; HS, Hispanic; SA, South Asian; M-A, meta-analysis. Error bars indicate 95% confidence intervals.
