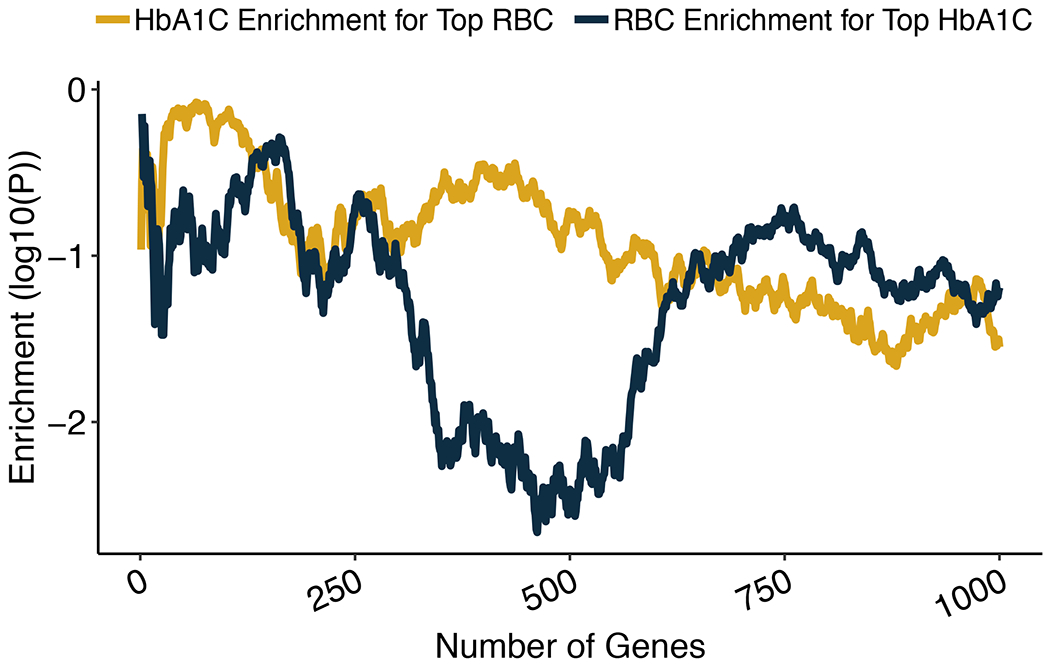
Extended Data Figure 4 |. Enrichment analyses of HbA1C and RBC rare variant gene-level associations.

We ranked genes by their HbA1C gene-level p-value and tested the degree to which the top n associations (with n ranging from 1 to 1,000) were enriched for red blood cell count (RBC) gene-level associations. Enrichments were calculated using a one-sided Wilcoxon rank-sum test, comparing the RBC gene-level p-values of the top n HbA1C associations to the RBC gene-level p-values of background genes matched on the number of variants and total allele count; the solid blue line in the plot shows the one-sided Wilcoxon p-values as a function of n. As a negative control, we also conducted the reciprocal analysis in which we tested the top i RBC associations for enrichment for HbA1C associations; the solid yellow shows the one-sided Wilcoxon p-values.
