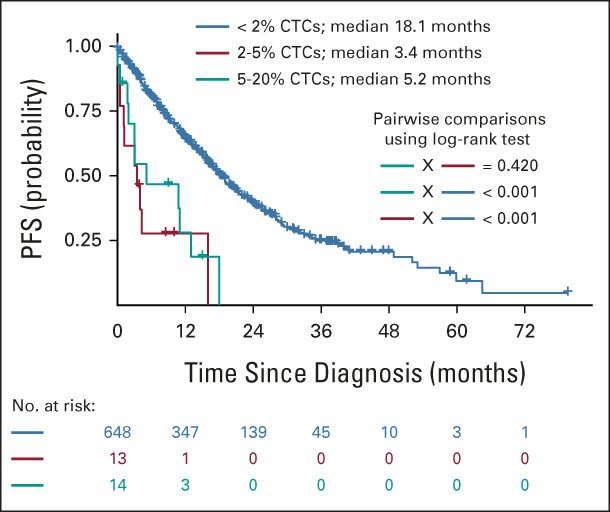
FIG 5.

Patients with 2%-5% display similar PFS as those with 5%-20% of CTCs. Kaplan-Meier curves for PFS of patients from the transplant-ineligible cohort merged with the patients from the GEM-CLARIDEX trial stratified according to < 2% (blue line), 2%-5% (red line), and 5%-20% (teal line). CTC, circulating tumor plasma cell; PFS, progression-free survival.
