. 2023 Mar 7;12:e81184. doi: 10.7554/eLife.81184

Figure 1. FABPi significantly impair MM cell growth and induces apoptosis.

(A) Confocal overlay immunofluorescence images show FABP5 (red) expressed in cytoplasm of GFP+/Luc+ MM.1S cells. Nuclei identified with DAPI (blue), cells stained with secondary antibody alone (control) or primary plus secondary antibodies (FABP5 staining), scale bar = 200 µm. (B) Comparison of basal gene expression of FABP isoforms in 30 myeloma cell lines. Data extracted from the Cancer Cell Line Encyclopedia (CCLE; DepMap, Broad (2022): DepMap 22Q2 Public. figshare. dataset. https://doi.org/10.6084/m9.figshare.19700056.v2), filtered in excel, and graphs made in Graphpad PRISM (v7.04) using scatter dot plots (mean ± SEM). (C, D) MM cell numbers after being exposed to (C) BMS309403 and (D) SBFI-26 for 72 hr; 50 µM dose (~EC50) indicated by arrows. (E) GFP+/Luc+MM.1S cell numbers after treatment with inhibitors in combination (50 µM each). Vehicle vs BMS309403 (24 hr, *; 48 hr, ****; 72 hr, ****). Vehicle vs SBFI-26 (24 hr, *; 48 hr, ****; 72 hr, ****). Vehicle vs BMS309403 +SBFI-26 (24 hr, ***; 48 hr, ****; 72 hr, ****). BMS309403 vs BMS309403 +SBFI-26 (48 hr, **; 72 hr, ****). SBFI-26 vs BMS309403 +SBFI-26 (48 hr, **; 72 hr, ****). Two-way ANOVA analysis with Tukey’s multiple comparisons test analysis. (F) CellTiter-Glo analysis of human mesenchymal stem cells after treatment with BMS309403 or SBFI-26 for 72 hr. Data are mean ± SEM and represent averages or representative runs of at least three experimental repeats. One-way ANOVA with Dunnett’s multiple comparison test significance shown as *p<0.05. **p<0.01. ***p<0.001. ****p<0.0001. **** p<0.0001. Please see 8 supplements to Figure 1.

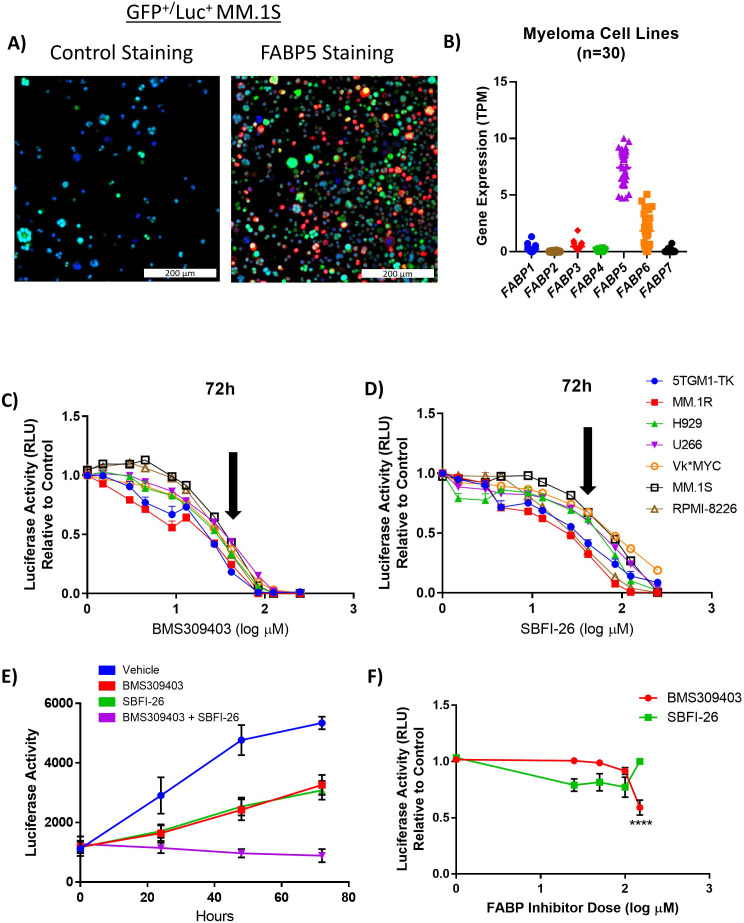
Figure 1.

Figure 1—figure supplement 1. Expression of FABP family members in MM and hematopoetic/lymphoid cell lines.

Figure 1—figure supplement 1.

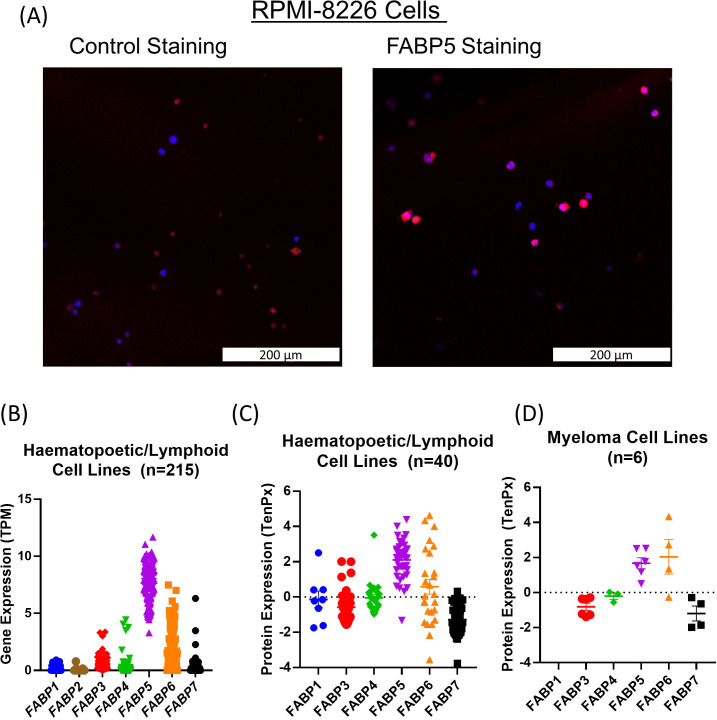
(A) Confocal overlay immunofluorescence images show FABP5 (red) primarily in cytoplasm. Nuclei identified with DAPI (blue) in RPMI-8226 cells. Cells stained with secondary antibody alone (left) and primary and secondary (right). (B,C) Gene and protein expression of FABP family members in cell lines of haematopoetic and lymphoid lineage. Comparison of basal gene expression of FABP1, FABP2, FABP3, FABP4, FABP5, FABP6, and FABP7 reveals higher expression of FABP5 and FABP6 in 215 cell lines (B). Mass spectrometry proteomics comparing protein expression of FABP1, FABP3, FABP4, FABP5, FABP6, and FABP7 in 40 cell lines of the haematopoetic/lymphoid lineage (C), six of which were myeloma cell lines (D). Data extracted from the Cancer Cell Line Encyclopedia (CCLE; DepMap, Broad (2022): DepMap 22Q2 Public. figshare. Dataset. https://doi.org/10.6084/m9.figshare.19700056.v2), filtered in excel, and graphs made in Graphpad PRISM using scatter dot plots (mean ± SEM) (v7.04).
Figure 1—figure supplement 2. FABP Depmap CERES scores in tumor cells show that FABP proteins are clinically relevant in MM.

Figure 1—figure supplement 2.

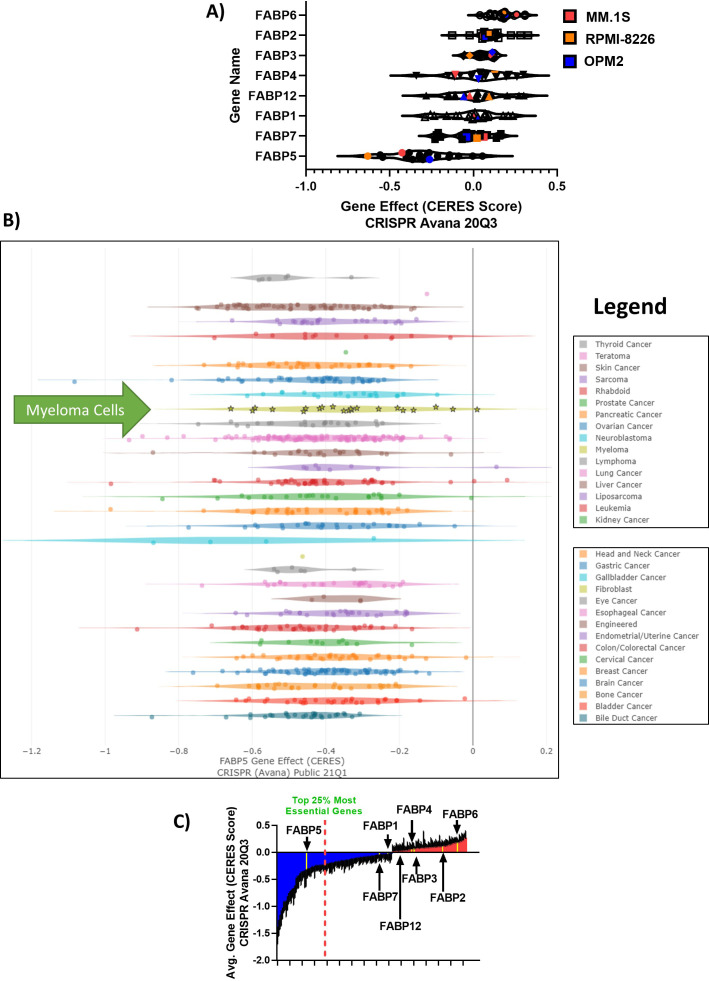
(A) CERES DepMap scores for the FABP members labeled with mean scores. (B) Derived from CRISPR Avana Public 21Q1 screen for all tumor cells available in Depmap database. FABP5 showed a negative value for all cancer types, demonstrating a dependency on FABP5 for tumor cell survival. Myeloma cells are highlighted with stars and green arrow. Legend provided is in the same order as the cell lines plotted. (C) Fatty acid metabolism-related genes in the DepMap; genes with negative scores in blue (essential) and positive scores (not essential) in red.
Figure 1—figure supplement 3. FABP5 knockout (KO) MM.1R myeloma cell line.

Figure 1—figure supplement 3.

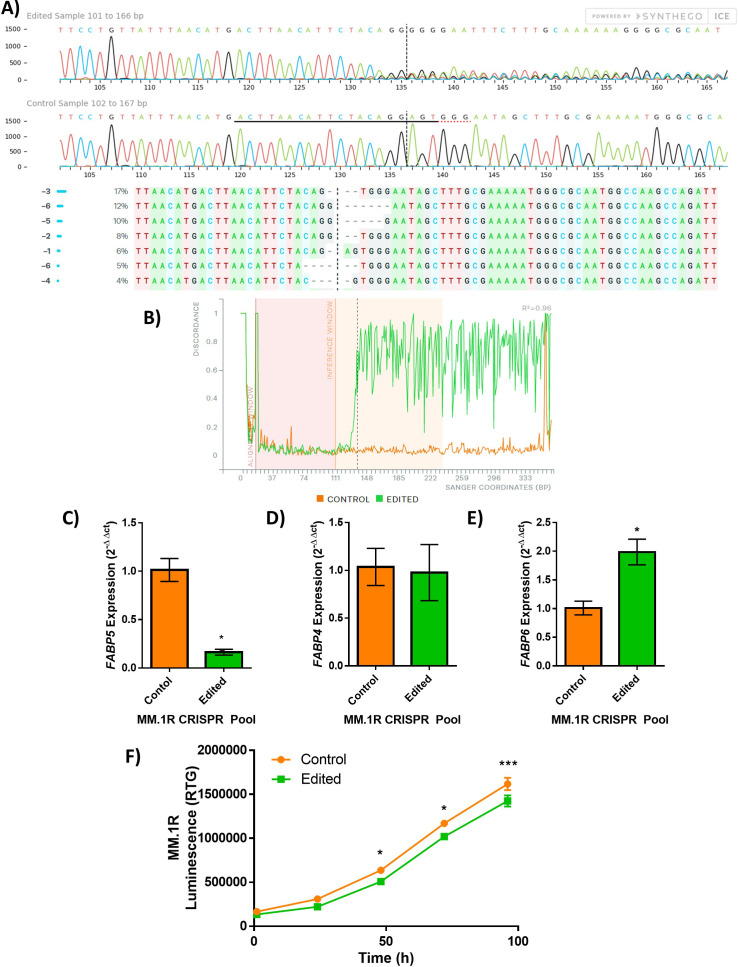
FABP5 was genetically targeted by CRISPR-Cas9 in the MM.1R human myeloma cell line (ATCC). (A) Sanger sequencing confirmation of KO (edited) and control (wild type) MM.1R populations including traces (top), and inferred sequences present in MM.1R edited population (middle, wild-type sequence ‘+’, panel). (B) Representation of alignment between the wild type (control, orange) and KO (edited, green) cells. In panels A,B, dotted lines indicate CRISPR-Cas9 cut site; data provided by Synthego. qRT-PCR analysis of the expression of FABP family members in the control (orange) and edited (green) pools: (C) FABP5, (D) FABP4, and (E) FABP6; n=3, data plotted as Mean ± SEM with significance determined by Student’s t-test (*P<0.05). (F) RealTime-Glo analysis of MM.1R cells in FABP5 control (orange) and edited (green) lines over time (n=8 wells per group), significance was determined by two-way ANOVA with Sidak’s multiple comparisons test (*p<0.05, ***p<0.001). Data plotted as Mean ± SEM for one experiment with eight technical wells; representative of two separate experiments.
Figure 1—figure supplement 4. FABP inhibitors exhibit consistent negative effects on cell number in eight myeloma cell lines.

Figure 1—figure supplement 4.

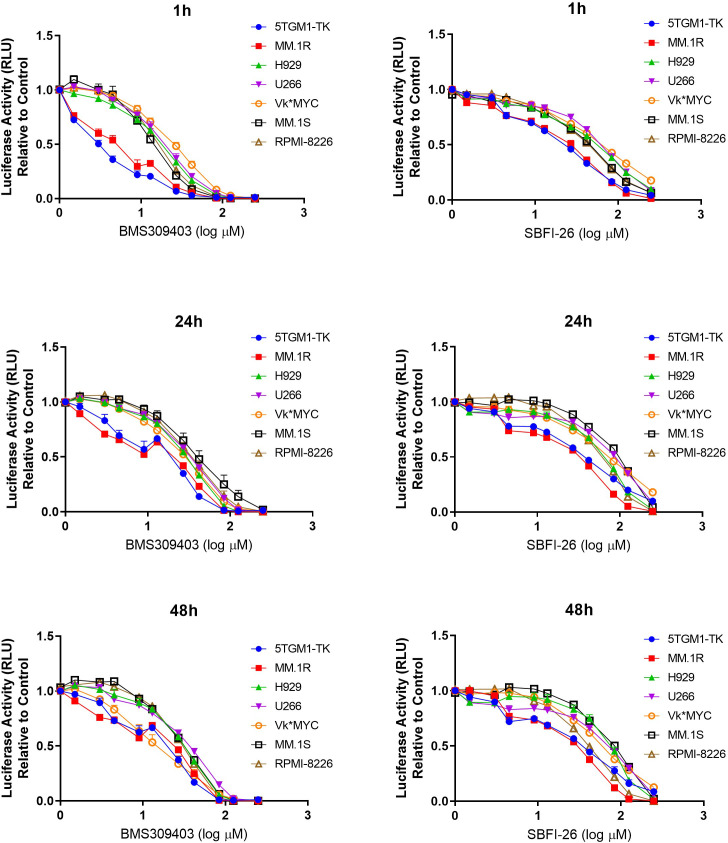
RealTime-Glo analysis of MM cell lines over time with FABP inhibitors demonstrates dose-dependent decreases in luciferase activity. Data represent mean ± SEM from at least three biological repeats. GFP+/Luc+MM.1S were used in these experiments with similar responses observed in ATCC MM.1S (data not shown).
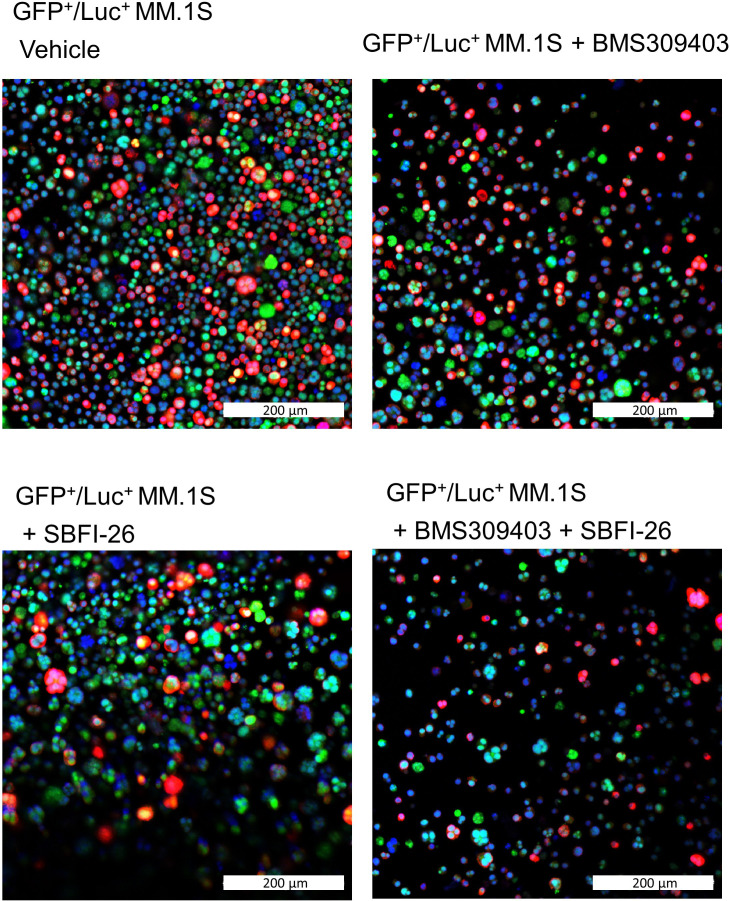
Figure 1—figure supplement 5. FABP inhibitor treatment did not induce changes in amount or localization of FABP5 in GFP+/Luc+MM.1 S cells.

Figure 1—figure supplement 5.

Immunofluorescence images with confocal overlay show cells stained for nuclei (DAPI, blue) and FABP5 (red) after treatment with vehicle control or FABP inhibitors (50 µM) for 24 hr. Representative confocal images from three wells.
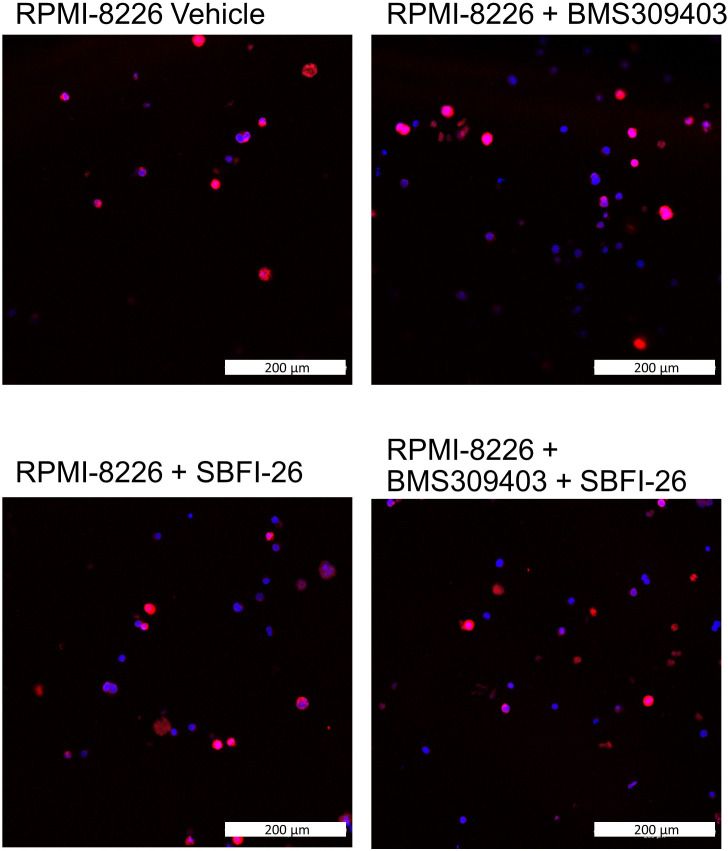
Figure 1—figure supplement 6. FABP inhibitor treatment did not induce changes in amount or localization of FABP5 in RPMI-8226 myeloma cells.

Figure 1—figure supplement 6.

Immunofluorescence images with confocal overlay show cells stained for nuclei (DAPI, blue) and FABP5 (red) after treatment with vehicle control or FABP inhibitors (50 µM) for 24 hr. Representative confocal images from three wells.
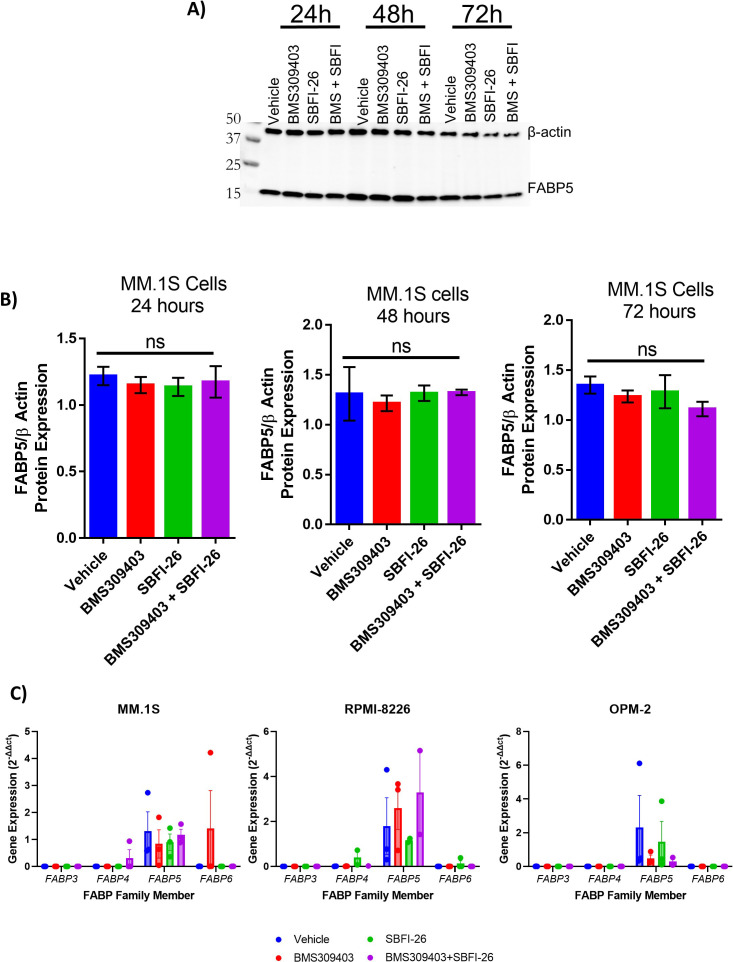
Figure 1—figure supplement 7. Protein levels of FABP5 are not affected by inhibitors in MM.1S cells.

Figure 1—figure supplement 7.

(A) Representative western blot of B-actin (housekeeping control) and FABP5 protein levels at 24, 48, and 72 hr after treatment with BMS309403 (50 µM), SBFI-26 (50 threeM) or the combination. (B) Quantification of western blots. Data represent Mean ± SEM from three biological repeats, analyzed with one-way ANOVA. (C) qPCR of 4 FABP family members in three human myeloma cell lines 24 hr after treatment with BMS309403 (50 µM), SBFI-26 (50 µM) or the combination; data represent Mean ± SEM from two to three biological repeats, analyzed with one-way ANOVA. All gene expression relative to FABP5 vehicle control. GFP+/Luc +MM.1 S used in panels A and B, ATCC MM.1S used in panel C.
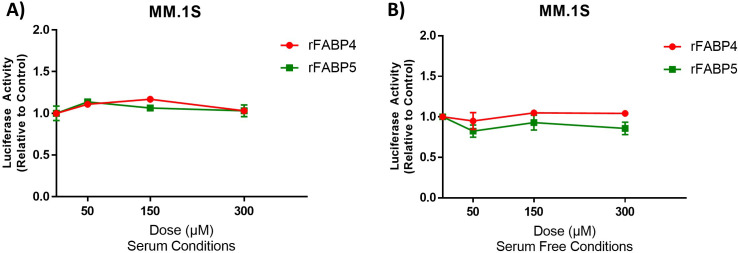
Figure 1—figure supplement 8. Treatment with recombinant FABP4 or FABP5 has no effect on GFP+/Luc+ MM.1 S cell numbers.

Figure 1—figure supplement 8.

Luciferase activity analysis after 72 hr of recombinant human FABP4 or FABP5 protein treatment in myeloma cells in 10% serum or serum free conditions. (A) Cell growth was monitored with exogenous luciferin after exposure to recombinant FABP4 or 5 (rFABP4 or rFABP5) protein in serum containing or (B) serum free conditions. Data represent n=3, Mean ± SEM, averages of at least three experimental repeats. Statistical analysis was determined with a one-way ANOVA for each recombinant FABP; no significance was observed.