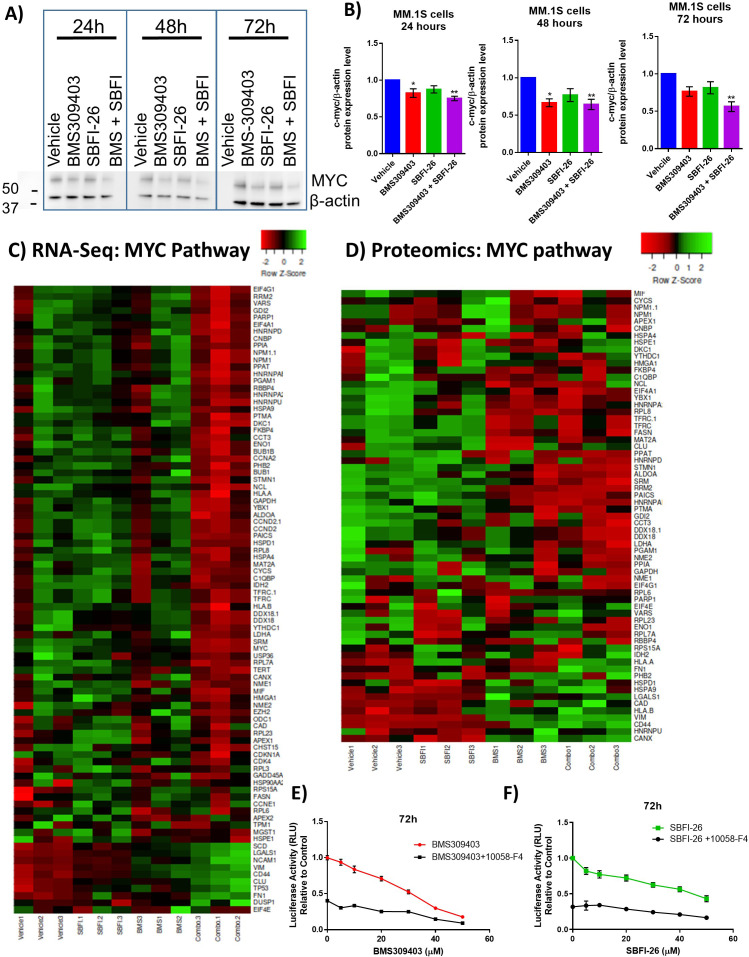
Figure 4. FABPi target MYC and the MYC pathway.
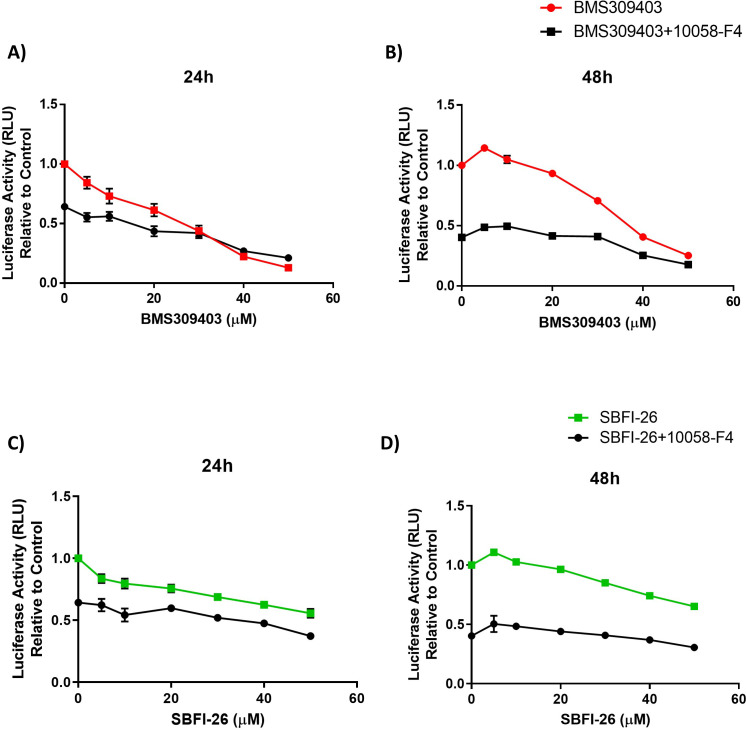
(A) Representative western blot and (B) quantification of MYC protein and β-actin (housekeeping control) at 24, 48, and 72 hr after treatment with BMS309403 (50 µM), SBFI-26 (50 µM), or the combination. (C) RNA-seq and (D) Proteomic analysis of expression of genes/proteins involved in MYC signaling shown as heatmap visualizations. Curated lists are based on IPA MYC Pathway list, known MYC-regulated genes, and proteins present in proteomics. (E) 72 hr BMS309403 dose curve with and without Myc inhibitor 10058-F4 (37.5 µM) in MM.1S cells. (F) 72 hr SBFI-26 dose curve with and without 10058-F4 (37.5 µM) in MM.1S cells. Data represent mean ± SEM from n=3 biological repeats, analyzed with one-way ANOVA with significance shown as *p<0.05. **p<0.01. ****p<0.0001. GFP+/Luc +MM.1 S cells were used for these experiments. Please see 1 supplement to Figure 4.


