. 2023 Mar 7;12:e81184. doi: 10.7554/eLife.81184

Figure 5. FABPi significantly induce reactive oxygen species, impair MM cell growth and induce apoptosis.

(A) Reactive oxygen species measured by MFI (mean fluorescent intensity) with CellROX Green staining at 72 hr in MM.1S cells. TBHP is positive control. (B) Superoxide levels shown as MFI, determined with MitoSOX staining, at 72 hr in MM.1S cells. (C) MM.1S cell cycle states with the FABPi alone (50 µM) or in combination (50 µM of each). (D) Apoptosis in MM.1S cells with FABPi as in C. Data are mean ± SEM unless otherwise stated and represent averages or representative runs of at least three experimental repeats. One-way ANOVA with Dunnett’s multiple comparison test significance shown as *p<0.05. **p<0.01. ***p<0.001. ****p<0.0001. ATCC MM.1S cells were used for these experiments. Please see 10 supplements to Figure 5.

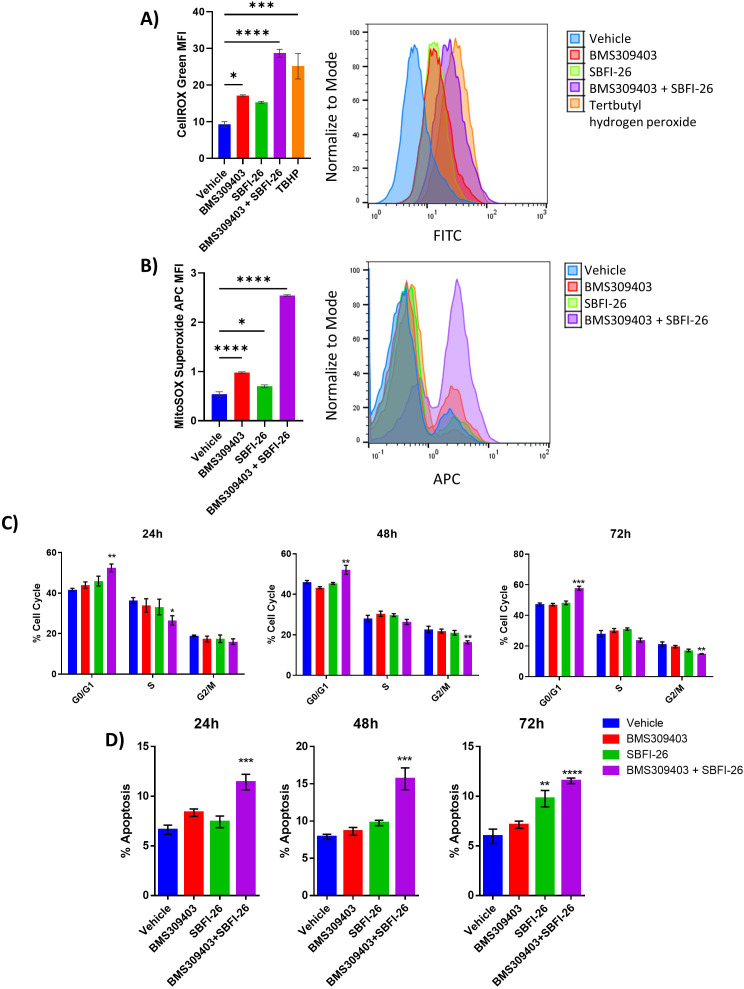
Figure 5.

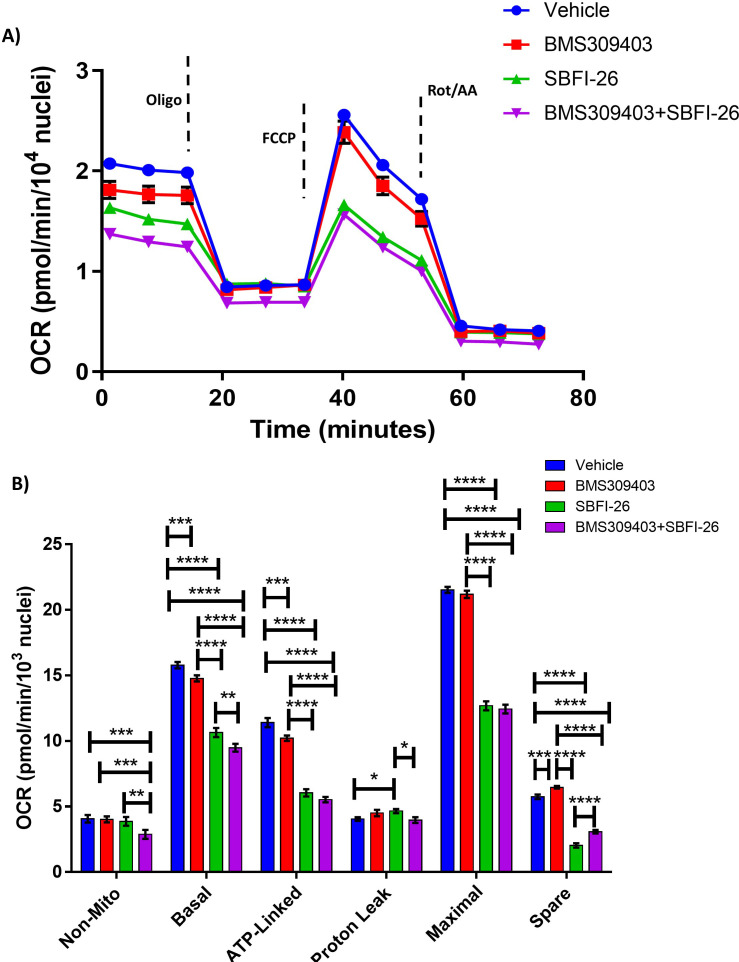
Figure 5—figure supplement 1. FABP blockade reduces cell metabolism: (A, B) GFP+/Luc+MM.1S cells were cultured for 24 hr with BMS309403 (50 µM), SBFI-26 (50 µM), or both and then plated for Seahorse XF96 analysis in 96-well format.

Figure 5—figure supplement 1.

Oxygen consumption in cells was measured in basal conditions and in response to oligomycin (1.25 µM), FCCP (1 µM), and rotenone and antimycin A (.5 µM). Results represent five independent experiments with 1 representative experiment shown. Data represent Mean ± SEM; two-way ANOVA was used for each parameter with Uncorrected Fisher’s LSD multiple comparison post-hoc testing for significance shown as: *p<0.05, **, p<0.01, ***p<0.005, ****p<0.001. ns = non-significant.
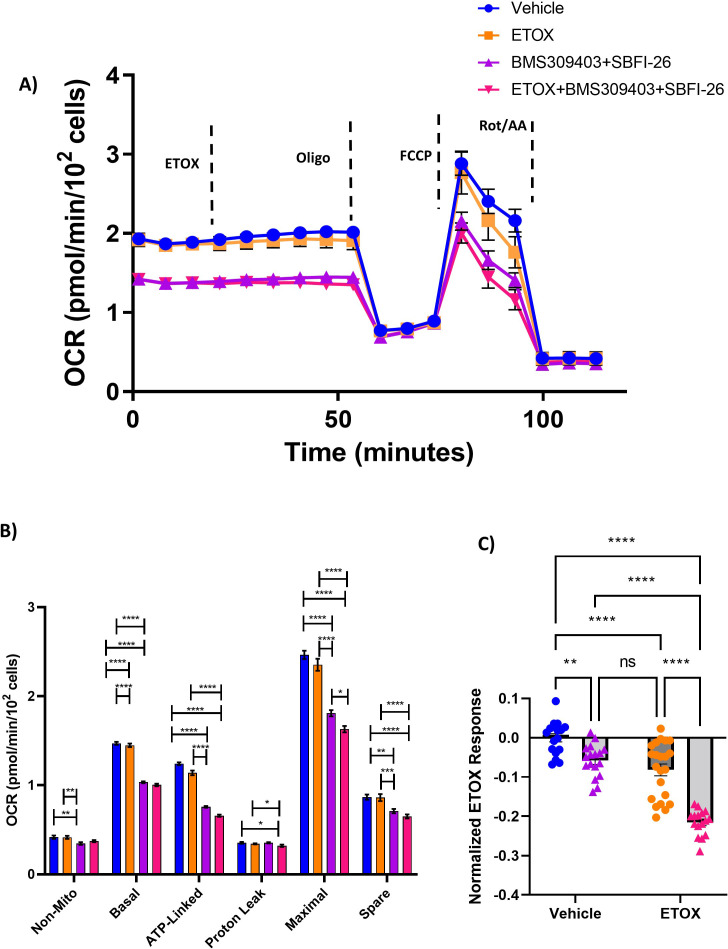
Figure 5—figure supplement 2. FABP blockade reduces fatty acid oxidation: (A,B) GFP+/Luc+MM.1S cells were cultured for 24 hr with BMS309403 (50 µM) plus SBFI-26 (50 µM) and then plated for Seahorse XF96 analysis in 96-well format.

Figure 5—figure supplement 2.

Oxygen consumption in cells was measured in basal conditions and in response to oligomycin (1.25 µM), FCCP (1 µM), and rotenone and antimycin A (.5 µM). Etomoxir or vehicle were added at the time point indicated at a final concentration of 4 µM prior to subjecting the cells to the mitochondrial stress test. (C) ETOX response data normalized to MM.1S Vehicle control cells. Data represent Mean ± SEM; two-way ANOVA was used for each parameter with Uncorrected Fisher’s LSD multiple comparison post-hoc testing for significance shown as: *p<0.05, **, p<0.01, ***p<0.005, ****p<0.001. ns = non-significant. Results represent two independent experiments with one representative experiment shown.
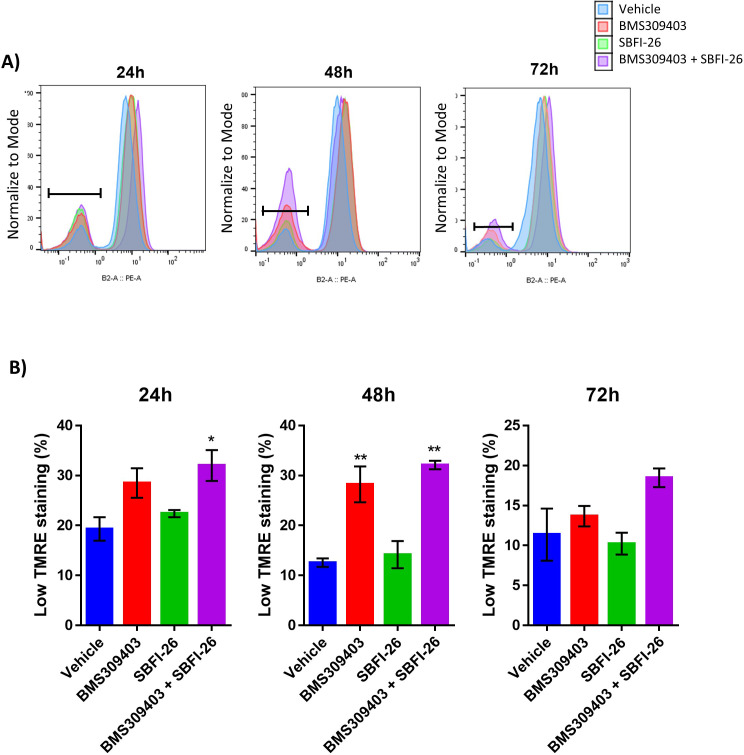
Figure 5—figure supplement 3. TMRE staining reveals compromised mitochondria in response to BMS309403 and the combination treatment.

Figure 5—figure supplement 3.

GFP+/Luc+ MM.1S cells were treated with vehicle (DMSO), BMS309403, SBFI-26, or the combination treatment for 24, 48, or 72 hr prior to staining with tetramethylrhodamine, ethyl ester (TMRE). Representative TMRE staining and flow cytometry gating (A) demonstrated an increase in TMRE (low) stained cells with BMS309403 or the combination treatment relative to vehicle. Low TMRE stained cells are quantified in panel B; plotted as mean ± SEM and analyzed with one-way ANOVA, **p<0.01, n=3.
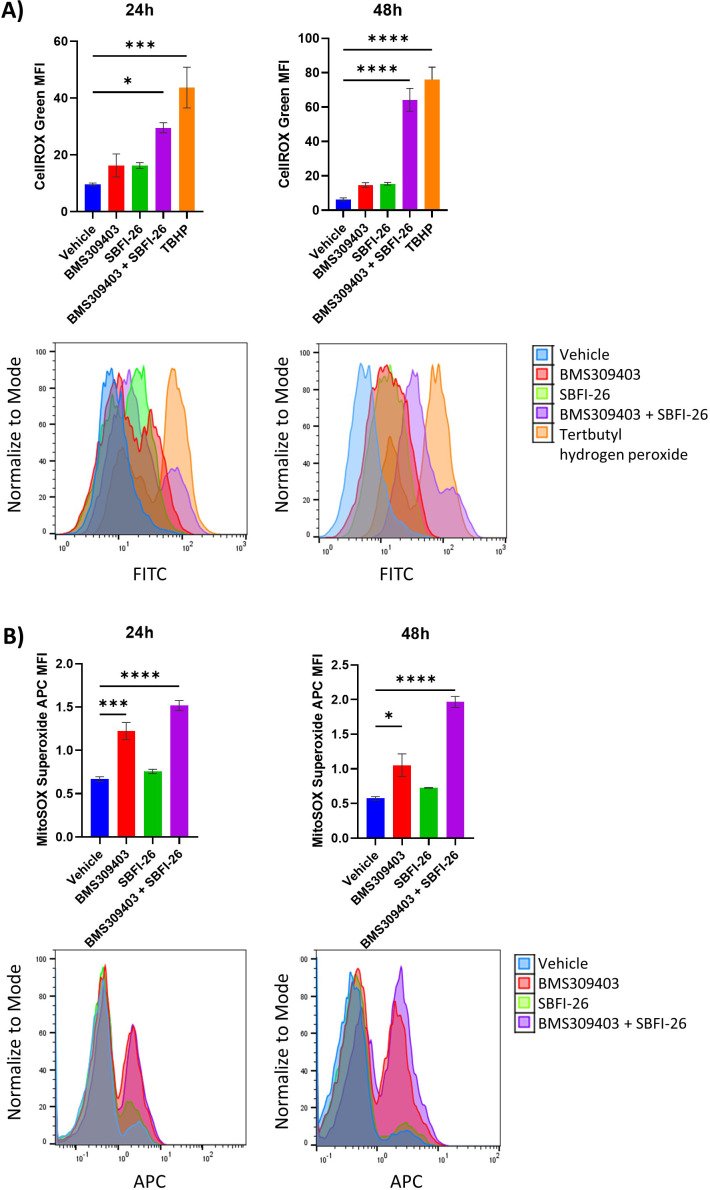
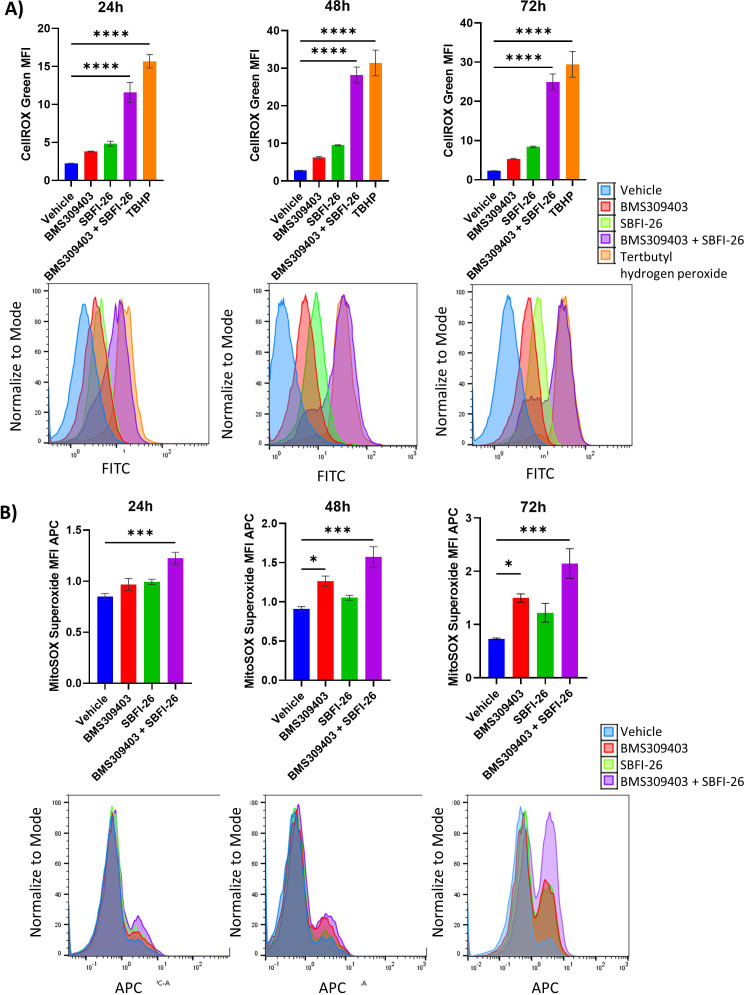
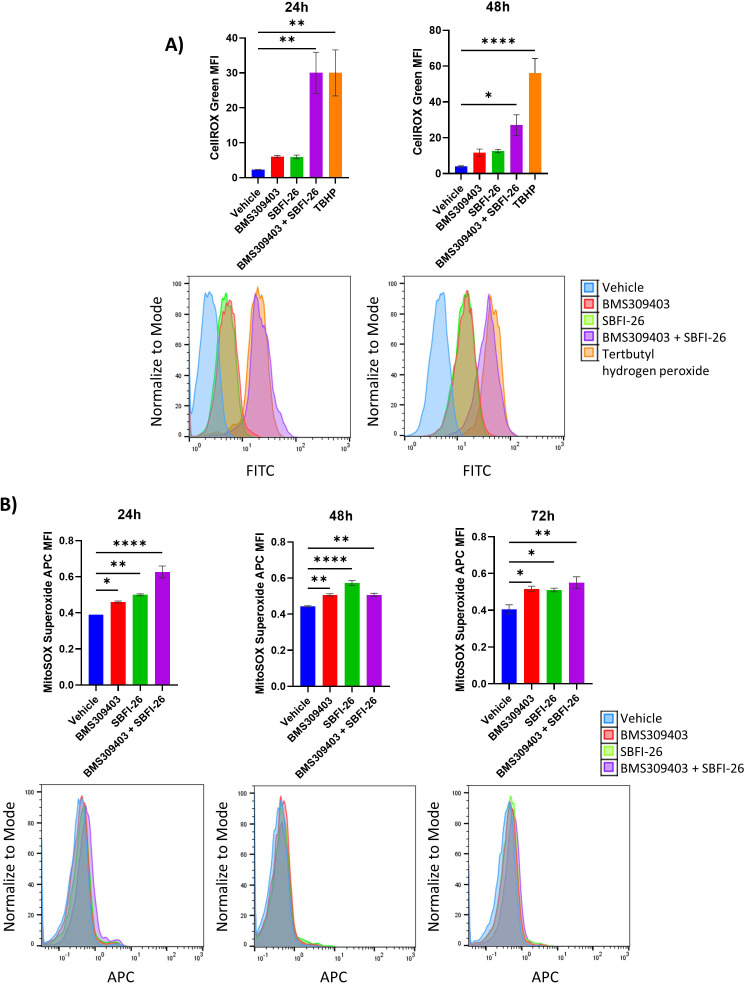
Figure 5—figure supplement 4. CellROX and Mitosox staining reveals an increase in total ROS and superoxide over 48 hr treatment with BMS309403 and combination therapy in MM.1S cells.

Figure 5—figure supplement 4.

ATCC MM.1S cells were treated with vehicle (DMSO), BMS309403, SBFI-26, or the combination treatment for 24 or 48 hr prior to staining with CellROX (A) or MitoSOX (B). Representative histograms for each timepoint demonstrate a shift with FABP inhibitor treatment. Plotted as mean ± SEM and analyzed with one-way ANOVA, *p<0.05, **p<0.01, ***p<0.001, ****p<0.0001, n=3.
Figure 5—figure supplement 5. CellROX and Mitosox staining reveals an increase in total ROS and superoxide over 72 hr treatment with BMS309403 and combination therapy in U266 cells.

Figure 5—figure supplement 5.

ATCC U266 cells were treated with vehicle (DMSO), BMS309403, SBFI-26, or the combination treatment for 24, 48, or 72 hr prior to staining with CellROX (A) or MitoSOX (B). Representative histograms for each timepoint demonstrate a shift with FABP inhibitor treatment. Plotted as mean ± SEM and analyzed with one-way ANOVA, *p<0.05, **p<0.01, ***p<0.001, ****p<0.0001 n=3.
Figure 5—figure supplement 6. CellROX and Mitosox staining reveals an increase in total ROS and superoxide over 72 hr treatment with BMS309403 and combination therapy in OPM2 cells.

Figure 5—figure supplement 6.

DSMZ OPM2 cells were treated with vehicle (DMSO), BMS309403, SBFI-26, or the combination treatment for 24 or 48 hr prior to staining with CellROX (A) or for 24, 48, or 72 hr prior to staining with MitoSOX (B). Representative histograms for each timepoint demonstrate a shift with FABP inhibitor treatment. Plotted as mean ± SEM and analyzed with one-way ANOVA, *p<0.05, **p<0.01, ***p<0.001, ****p<0.0001 n=3.
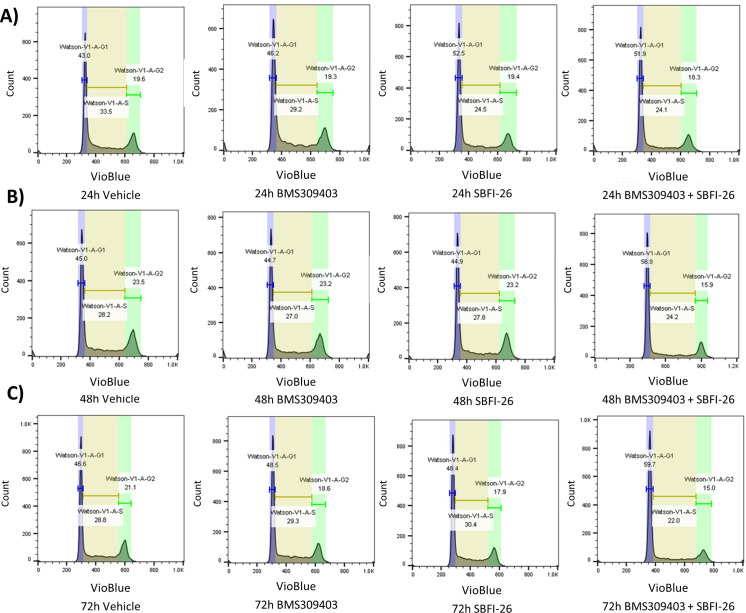
Figure 5—figure supplement 7. MM.1S cell cycle gating after FABP inhibitor treatment.

Figure 5—figure supplement 7.

GFP+/Luc+ MM.1S cells were treated with either 50 µM BMS309403, 50 µM SBFI-26, or a combination of both at 24 (A), 48 (B), and 72 (C) hr. The phases of the cell cycle were determined using the Watson Pragmatic algorithm via FlowJo software.
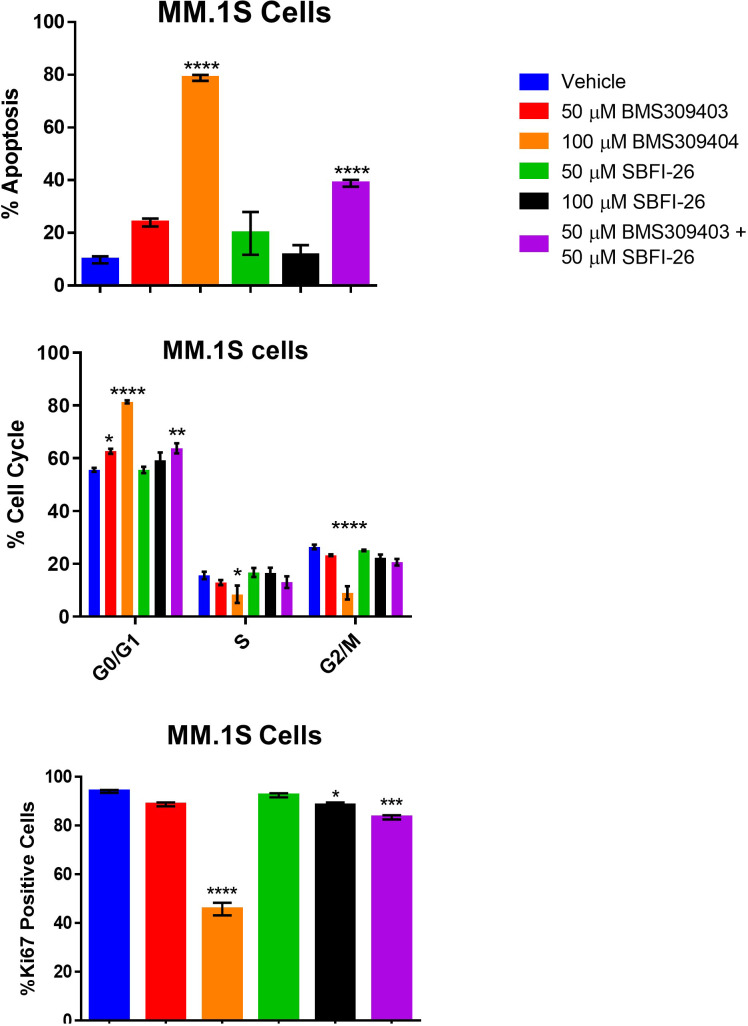
Figure 5—figure supplement 8. Apoptosis, cell cycle arrest and reduction in Ki67 expression is induced in GFP+/Luc+ MM.1 S cells through inhibition of FABP proteins at 72 hr.

Figure 5—figure supplement 8.

Data represent Mean ± SEM of least three experimental repeats with at least two technical samples per experiment. One-way ANOVA and Dunnett’s Multiple comparison testing was used; *p<0.05, **, p<0.01, ***p<0.005, ****p<0.001.
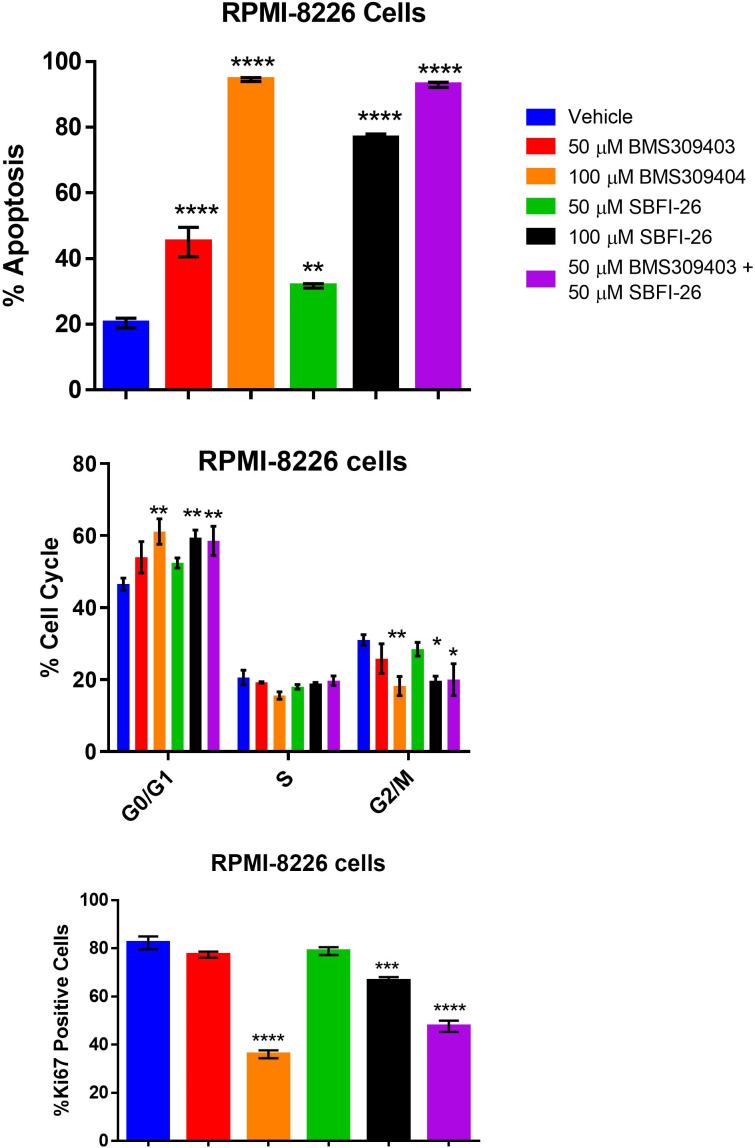
Figure 5—figure supplement 9. Apoptosis, cell cycle arrest and reduction in Ki67 expression is induced in RPMI-8226 cells through inhibition of FABP proteins at 72 hr.

Figure 5—figure supplement 9.

Data represent Mean ± SEM of least three experimental repeats with at least two technical samples per experiment. One-way ANOVA and Dunnett’s Multiple comparison testing was used; *p<0.05, **, p<0.01, ***p<0.005, ****p<0.001.
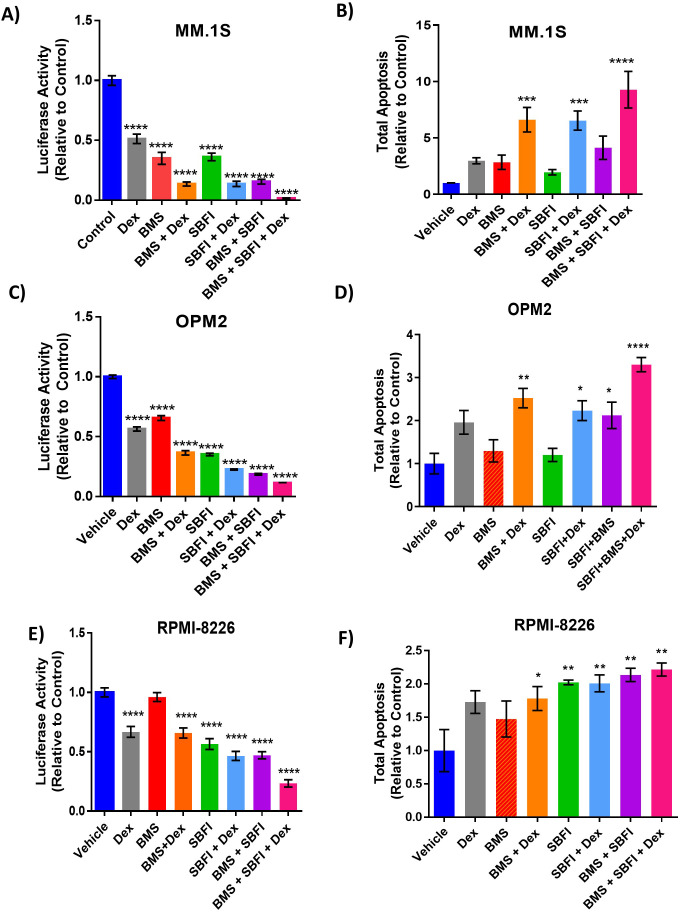
Figure 5—figure supplement 10. The effects of FABP inhibitors combined with dexamethasone after 72 hr in vitro.

Figure 5—figure supplement 10.

Combination of inhibitor treatment with dexamethasone results. Cell numbers in GFP+/Luc +MM.1 S (A, n=3) and OPM-2 (C, n=4) as assessed by luciferin spike-in, and RPMI-8226 as assessed by CellTiter-Glo (E, n=3), normalized to control. Apoptosis results in GFP+/Luc +MM.1 S (B, n=3), OPM-2 (D, n=3) and RPMI8226 (F, n=3). All graphs represent mean ± SEM and significance compared to the control is determined by one-way ANOVA with Dunnett’s multiple comparisons test. *p<0.05, **, p<0.01, ***p<0.005, ****p<0.001.