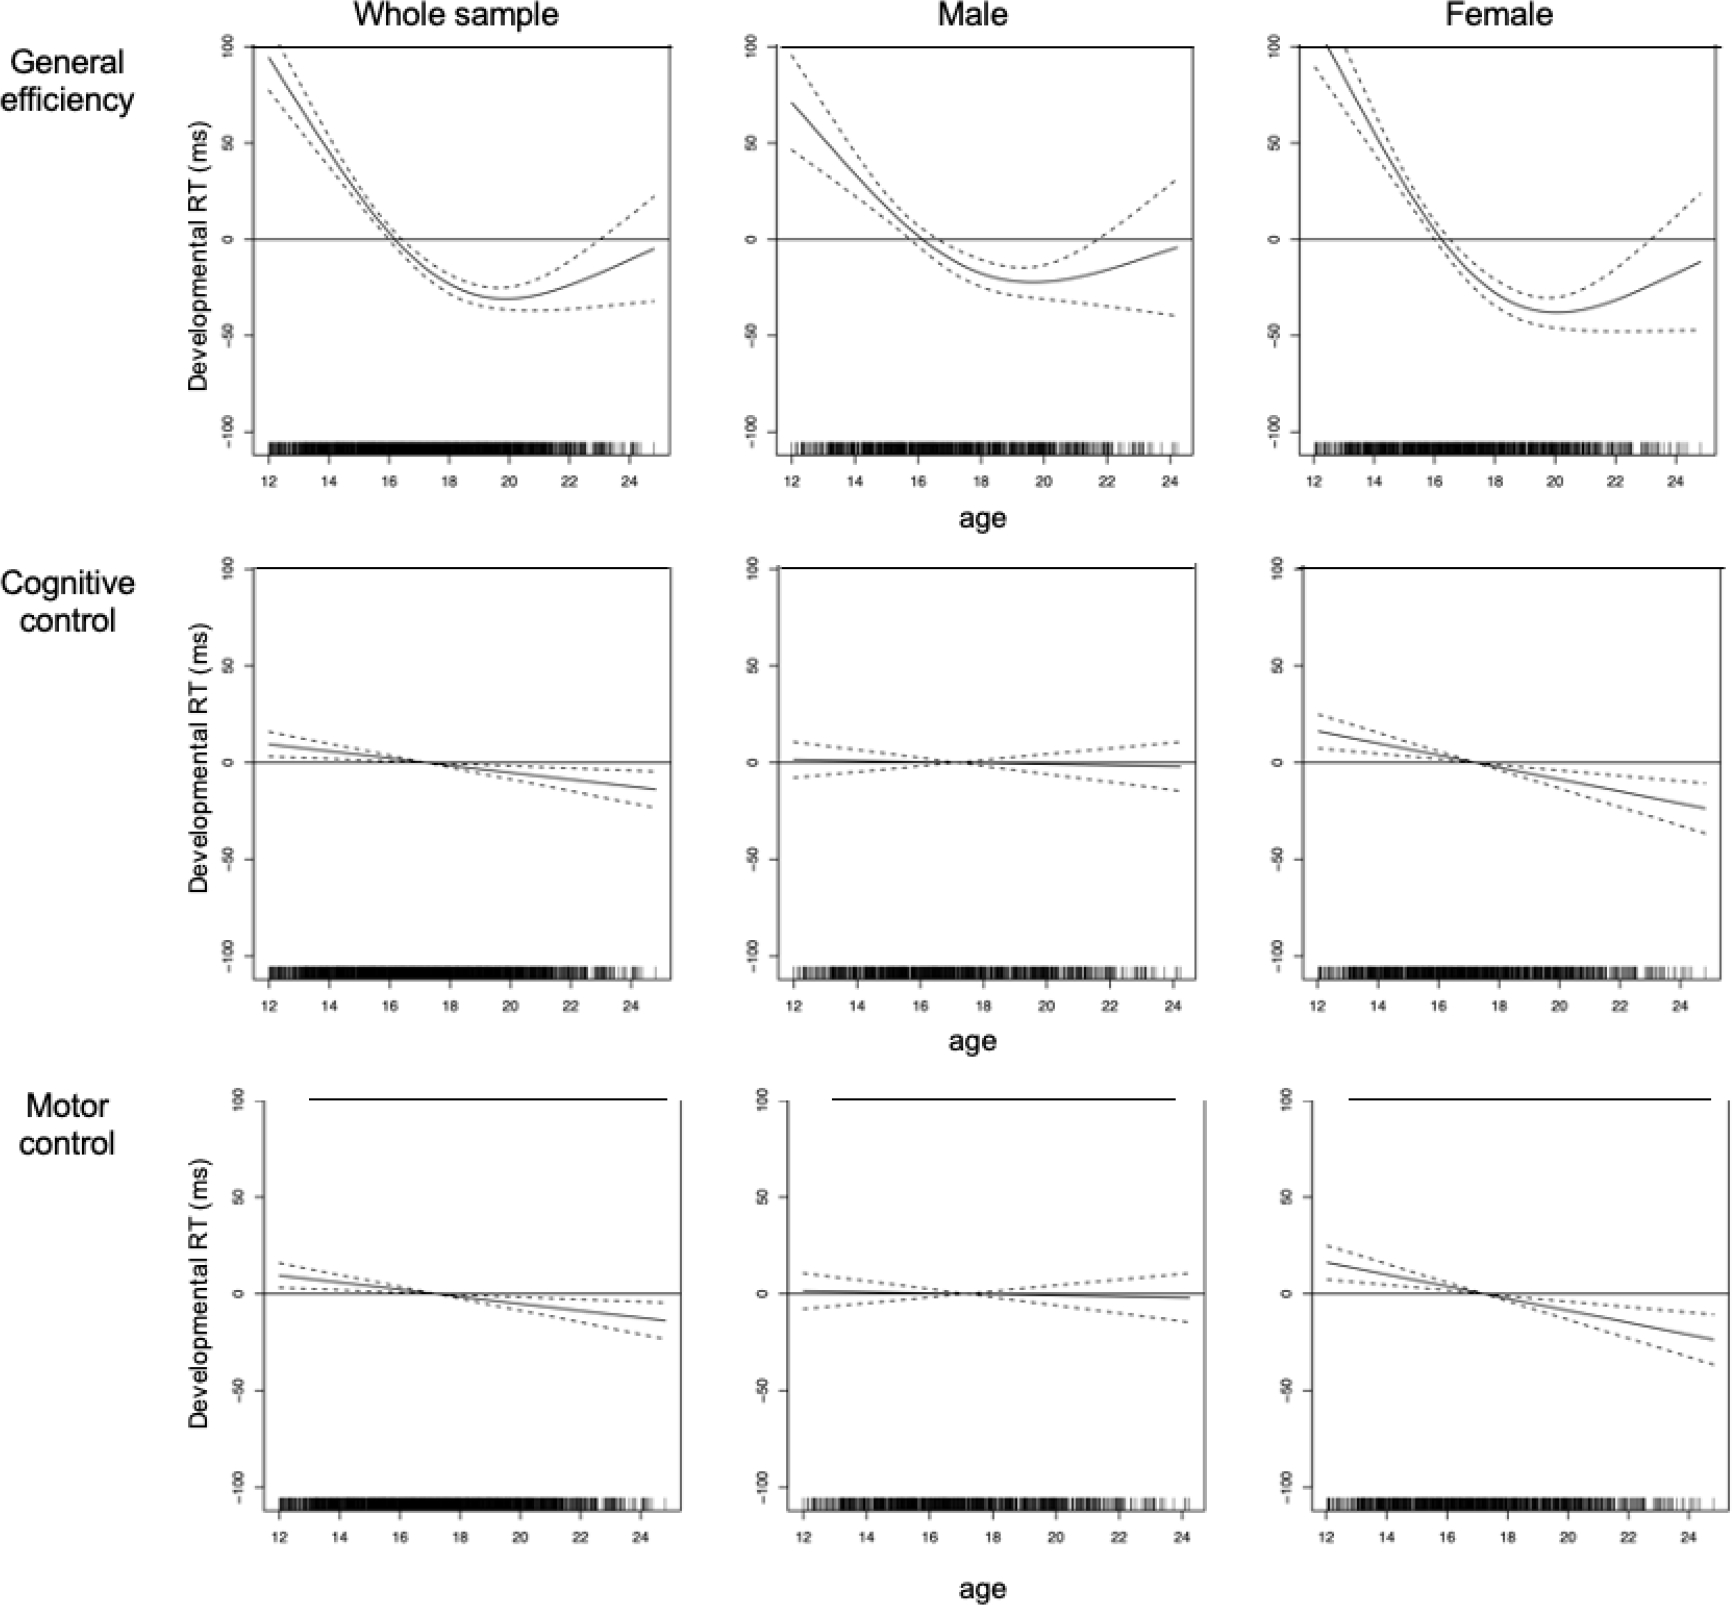
Figure 3.

Note. Figure 3 depicts developmental effects plotted against age (x-axes) by sex (from left to right: in the whole sample [n=445], in male [n=210], in female [n=235]). Results are presented for general efficiency, cognitive control, and motor control. Lower difference RTs represent faster processing speed (general efficiency), and improved control over cognitive interference and motor responses. Solid lines represent the developmental slopes and dashed lines the confidence intervals. Y-axes represent standardized developmental RTs.
