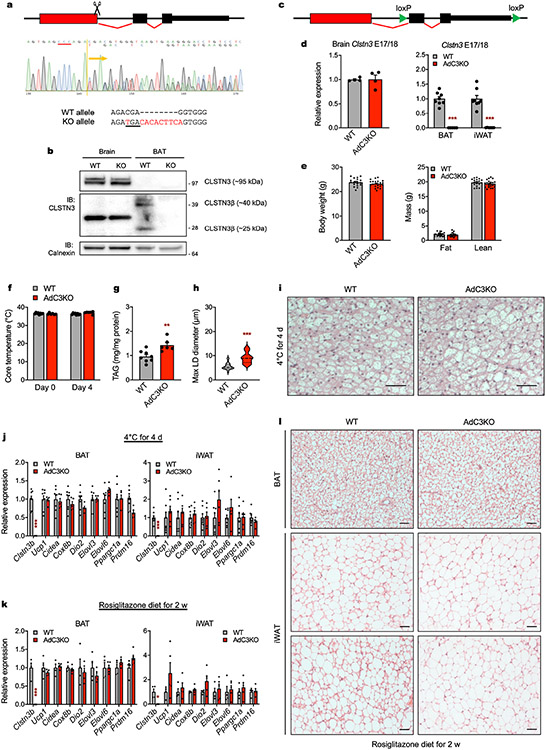
Extended Data Fig. 5 ∣. Analysis of thermogenesis in CLSTN3β-deficient mice.
a, (Top) Schematic of CRISPR strategy used to generate CLSTN3β KO mice. Scissors mark position of gRNA. (Middle) CRISP-ID analysis of Sanger sequencing trace from CLSTN3β KO founder. PAM sequence is underlined in red. (Bottom) Nucleotide sequences of WT and CLSTN3β KO alleles. Bases altered in KO allele are highlighted in red and premature stop codon is underlined. b, Western blot analysis of membrane preparations of brain and BAT from WT and CLSTN3β KO mice housed at 22 °C. c, Schematic of Cre-Lox strategy used to generate AdC3KO mice. d, qPCR analysis of Clstn3 exons 17/18 expression in (left) brain from WT and AdC3KO mice housed at 22 °C (n = 4, 4) and (right) BAT and iWAT from WT and AdC3KO mice housed at 4 °C for 4 days (n = 8, 6). e, Body weights and compositions of 10-12 week-old male WT and AdC3KO mice on a normal chow diet (n = 18, 22). f, Core body temperatures, g, BAT TAG content, and h, diameters of largest LDs (n = 40, 40) in i, H&E sections of BAT from 10-11 week-old male WT and AdC3KO mice housed at 4 °C for 4 days (n = 8, 6). Scale bar = 50 μm. j, qPCR analysis of BAT and iWAT from 10-11 week-old male WT and AdC3KO mice housed at 4 °C for 4 days (n = 8, 6). k, qPCR analysis and l, H&E sections of BAT and iWAT from 12-14 week-old male WT and AdC3KO mice fed a 10% kcal fat diet containing 50 mg/kg rosiglitazone for 2 weeks (n = 4, 5). Scale bar = 50 μm. Bar plots show mean ± SEM. Each point represents a biological replicate. Violin plots show median (dashed) and quartiles (dotted). Two-sided *P < 0.05, **P < 0.01, ***P < 0.001 by multiple t-tests with Holm-Sidak correction (d,j-k) or Welch’s t-test (g-h).

