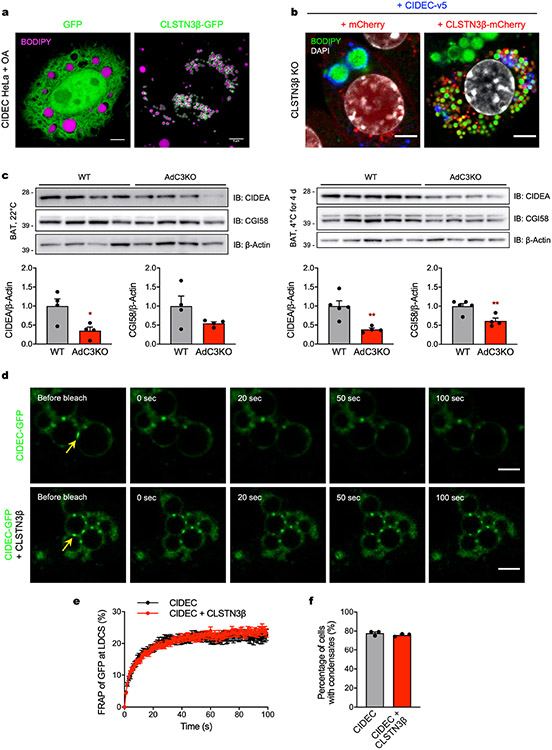
Extended Data Fig. 12 ∣. CLSTN3β associates with CIDE proteins and blocks LD fusion.
a, Confocal microscopy of HeLa cells stably expressing CIDEC and transiently expressing either GFP or CLSTN3β-GFP. Cells were treated with OA and LDs were stained with BODIPY 665. Scale bar = 5 μm. b, Confocal microscopy of immortalized CLSTN3β KO brown adipocytes stably expressing mCherry or CLSTN3β-mCherry and CIDEC-v5 (day 5 of differentiation). Cells were stained with BODIPY 488, DAPI, and anti-v5, and mCherry signal was amplified with anti-mCherry Alexa Fluor 594. Scale bar = 5 μm. c, (Top) Western blot analysis of BAT from male WT and AdC3KO mice housed at (left) 22 °C or (right) 4 °C for 4 days. (Bottom) Quantification of above Western blots. d, Representative images of FRAP-based phase separation assay. Yellow arrows point to bleached signal at LD–LD contact sites (LDCS). Scale bar = 2 μm. e, Quantification of FRAP-based phase separation assay (n = 22 cells). f, Percentage of cells with CIDEC condensates in the absence or presence of CLSTN3β (n = 3). Bar/line plots show mean ± SEM. Each point represents a biological replicate. Two-sided *P < 0.05, **P < 0.01 by Welch’s t-test (c).

