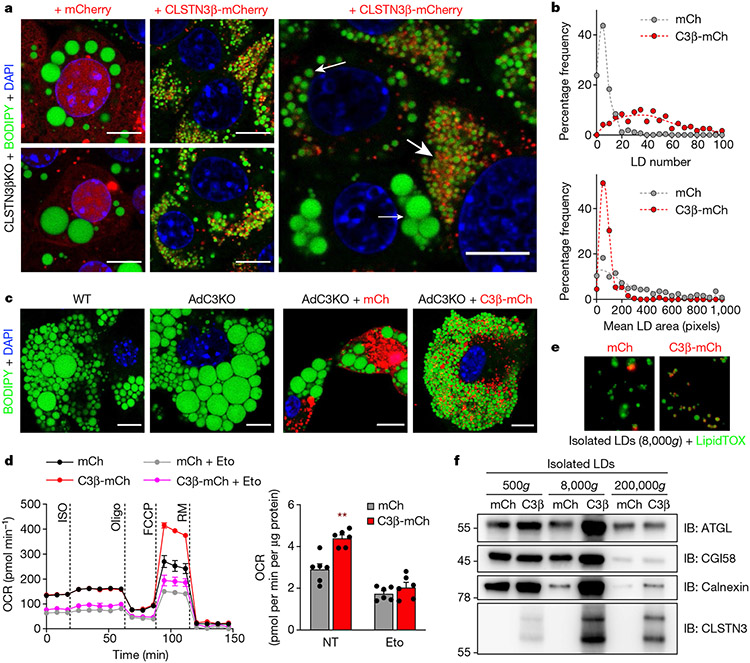
Fig. 3 ∣. Forced expression of CLSTN3β promotes multilocularity and lipid utilization in adipocytes.
a, Left, confocal microscopy of immortalized CLSTN3β KO brown adipocytes stably expressing mCherry (left) or CLSTN3β-mCherry (right) (day 5 of differentiation). Cells were stained with BODIPY 488 and DAPI, and mCherry signal was amplified with anti-mCherry Alexa Fluor 594. Right, cells with high CLSTN3β expression had the smallest LDs (large arrow), those with medium CLSTN3β expression had larger LDs (medium arrow) and those with low CLSTN3β expression had the largest LDs (small arrow). Scale bar, 10 μm. b, Frequency distribution of LD number (top) and mean LD size per cell in a (bottom). 272 and 244 cells were analysed for mCherry (mCh) and CLSTN3β-mCherry (C3β-mCh), respectively. c, Confocal microscopy of WT and AdC3KO primary brown adipocytes (day 6 of differentiation) (left) and AdC3KO primary brown adipocytes transduced with mCh or C3β-mCh lentivirus (day 4 of differentiation) (right). Cells were stained with BODIPY 488 and DAPI. Scale bar, 10 μm. d, Left, Seahorse respirometry analysis of oxygen consumption rate (OCR) in immortalized CLSTN3β KO brown adipocytes stably expressing mCh or C3β-mCh (day 6 of differentiation) and treated with isoproterenol (ISO, 10 μM), oligomycin (oligo, 4 μM), FCCP (2 μM) and rotenone/myxothiazol (RM, 7.5 μM). Cells were pretreated with etomoxir (Eto, 10 μM) for 30–45 min where indicated. Right, FCCP-induced OCR normalized to protein content (n = 6). e,f, Fluorescence microscopy (e) and western blot analysis (f) of large (500g), medium (8,000g) and/or small (200,000g) LDs isolated from immortalized CLSTN3β KO brown adipocytes stably expressing mCh or C3β-mCh (day 8 of differentiation). Equal amounts of TAG from each condition were loaded onto the gels. Bar/line plots show mean ± s.e.m. Each point represents a biological replicate. Two-sided **P < 0.01 by multiple t-tests with Holm–Sidak correction (d).

