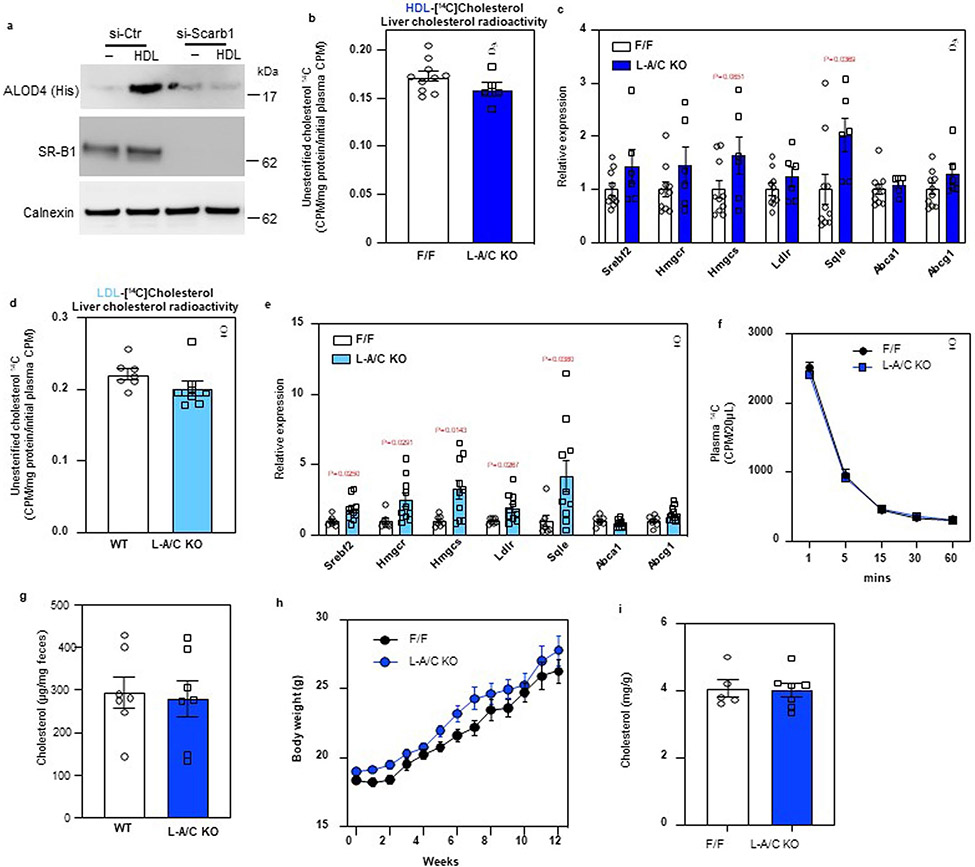
Extended Data Fig. 4 ∣. Asters transport lipoprotein-derived cholesterol from the PM to ER in hepatocytes.
a. Immunoblot analysis of ALOD4 binding in control or Sr-b1 knockdown HAECs after treatment with vehicle or HDL (400 ug/ml) for 1-h. Calnexin was used as a sample processing control. b, [14C] counts in liver unesterified cholesterol of mice from Fig. 6c (n = 10/6). c, mRNA expression levels of the indicated genes in the livers of mice from Fig. 6c (n = 10/6). d, [14C] counts in unesterified cholesterol in the livers of mice from Fig. 6g (n = 7/9). e, mRNA expression levels of the indicated genes in the livers of mice from Fig. 6g (n = 7/9). f, The rate of [14C] lipoprotein clearance from the circulation (n = 6/5), related to Figs. 6j-6m. Data are represented as mean ± SEM with individual animals noted as dots. *p < 0.05. g. Fecal cholesterol analysis of F/F and L-A/C KO mice fed a cholesterol-free diet for 48 hours (n = 7/7). h, Growth curves for F/F and L-A/C KO mice fed a Western diet from 8 weeks of age (n = 8/12). Masses are shown as mean ± SEM. i, Whole-body cholesterol content from F/F control and L-A/C KO mice on chow diet at 15 weeks old (n = 5/7). All data are presented as mean ± SEM. P values were determined by two-sided Student’s t-test (b, d, g and i), two-sided Student’s t-test with Benjamini, Krieger and Yekutieli correction (c and e), or two-way ANOVA with Sidak’s correction for multiple comparisons (h).

