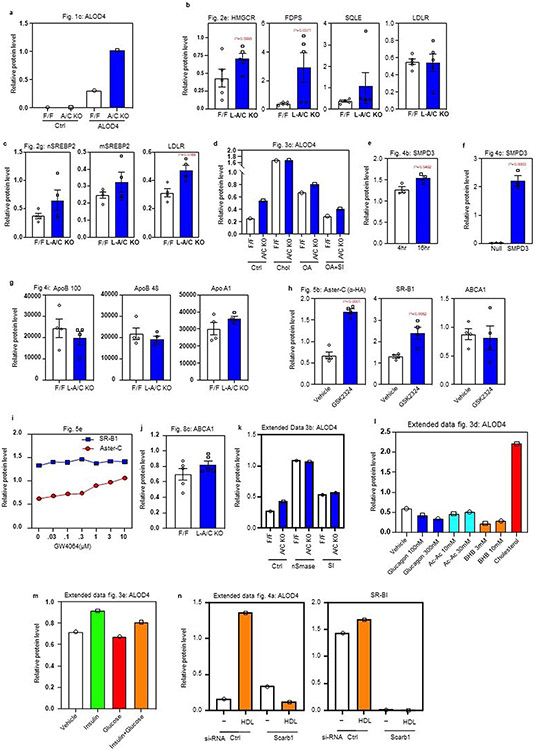
Extended Data Fig. 6 ∣. Western blot quantifications.
a, Western blot quantifications of ALOD4 binding from Fig. 1c. Normalized to loading control Actin (n = 1). b, Western blot quantifications of indicated proteins from Fig. 1c. Normalized to sample processing control calnexin (n = 5). c, Western blot quantifications of indicated proteins from Fig. 2g. Normalized to sample processing controls calnexin or lamin a/c (n = 4). d, Western blot quantifications of ALOD4 binding from Fig. 3c. Normalized to loading control actin (n = 1). e and f, Western blot quantifications of SMPD3 from Fig. 4b and Fig. 4c. Normalized to loading control actin (n = 3). g, Western blot quantifications of indicated proteins from Fig. 4i. Equal amounts of protein was loaded for each line (n = 4). h, Western blot quantifications of indicated proteins from Fig. 5b. Normalized to sample processing control calnexin (n = 4). i, Western blot quantifications of indicated proteins from Fig. 5e. Normalized to actin which served as a loading control for SRB1 and a sample processing control for Aster-C (n = 1). j, Western blot quantifications of ABCA1 from Fig. 8c. Normalized to sample processing control calnexin (n = 5). k, l and m, Western blot quantifications of ALOD4 binding from extended data Figs. 3b, 3d and 3e. Normalized to loading control actin or calnexin (n = 1). n, Western blot quantifications of ALOD4 binding and Sr-B1 from Fig. 4a. Normalized to calnexin which served as a loading control for ALOD4 and a sample processing control for SRB1 (n = 1). Data are presented as mean ± SEM. P values were determined by two-sided Student’s t-test (b, c, e, f and h).

