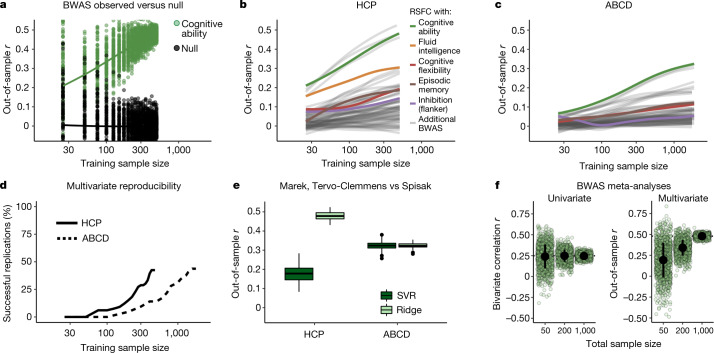
Fig. 2. BWAS reproducibility, scope and prediction accuracy using the method of Spisak et al.
a, Example bootstrapped BWAS of total cognitive ability (green) and null distribution (black) (y axis), as a function of sample size (x axis) from the suggested method of Spisak et al.8 (RSFC by partial correlation; prediction by ridge regression) in the HCP dataset (n = 1,200, 1 site, 1 scanner, 60 min RSFC/participant, 76% white). Sample sizes were log10-transformed for visualization. b, Out-of-sample correlation (between true scores and predicted scores) from ridge regression (y axis; code from Spisak et al.8) as a function of training sample size (x axis, log10 scaling) for 33 cognitive and mental health phenotypes (Supplementary Information) in the HCP dataset. Each line displays a smoothed fit estimate (through penalized splines in general additive models) for a brain (RSFC (partial correlations, as proposed by Spisak et al.8), cortical thickness) phenotype pair (66 total) that has 100 bootstrapped iterations from sample sizes of 25 to 500 (inclusive) in increments of 25 (20 total bins). Sample sizes were log10-transformed (for visualization) before general additive model fitting. c, The same as in b, but in the ABCD dataset (n = 11,874, 21 sites, 3 scanner manufacturers, 20 min RSFC/participant, 56% white) using 32 cognitive and mental health phenotypes at sample sizes of 25, 50, 75 and from 100 to 1,900 (inclusive) in increments of 100 (22 total bins). d, The percentage of brain–phenotype pairs (BWAS) from b and c with significant replication on the basis of the method of Spisak et al.8 (Supplementary Information). e, Comparison of our original method in our previous study1 and the method proposed by Spisak et al.8 at the full split-half sample size of HCP (left) and ABCD (right). Out-of-sample correlations (RSFC with total cognitive ability, y axis) for the method used in our previous study1 (dark green; RSFC by correlation, PCA, SVR) and by Spisak et al.8 (light green; RSFC by partial correlation, ridge regression). Repeating the method proposed by Spisak et al.8 in ABCD (right) and comparing this to the method used in our previous study1 results in a very similar out-of-sample r. f, Simulated individual studies (light green circles; n = 1,000 per sample size) and meta-analytic estimates (black dot, ±1 s.d.) using the method of Spisak et al.8 (partial correlations in the HCP dataset) for the largest univariate association (left; y axis, bivariate correlation) and multivariate association (right; y axis, out-of-sample correlation) for total cognitive ability versus RSFC, as a function of total sample size (x axis; bivariate correlation for sample sizes of 50, 200 and 1,000, and multivariate sum of train and test samples, each 25, 100 and 500). For univariate approaches, studies of any sample size, when appropriately aggregated to a large total sample size, can correctly estimate the true effect size. However, for multivariate approaches, even when aggregating across 1,000 independent studies, studies with a small sample size produce prediction accuracies that are downwardly biased relative to large sample studies, highlighting the need for large samples in multivariate analyses.

