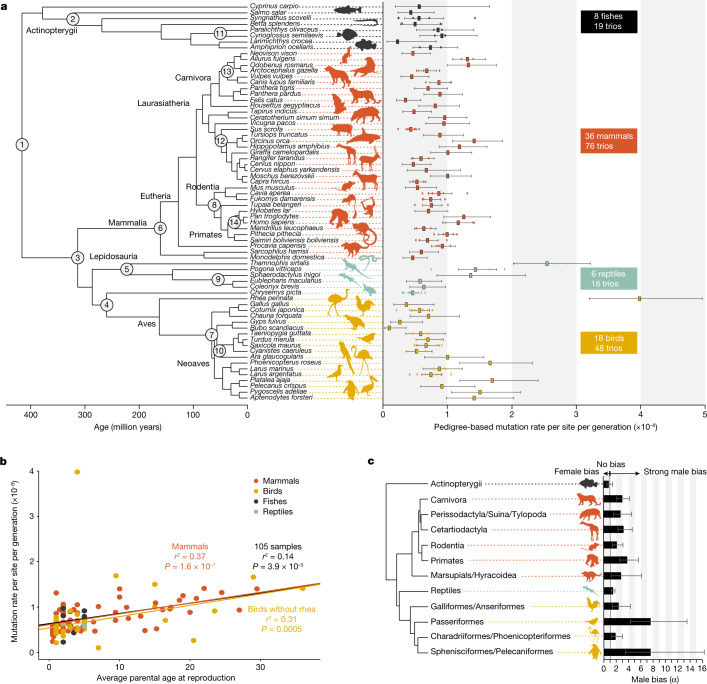
Fig. 1. Variation in GMRs and their association with life-history traits across 68 vertebrate species.
a, The phylogenetic tree of 68 species is based on UCE data and is calibrated with fossil data at 14 nodes (see Methods; Extended Data Fig. 3 and Supplementary Fig. 8). The average pedigree-based mutation rates per generation for each species, which are represented by the squares, show 40-fold variation among species. The 95% binomial confidence intervals are shown, and individual trios are represented by round points. See Supplementary Table 8 and Extended Data Fig. 4 for a comparison with published estimated rates of closely related species. b, The per-generation mutation rate is significantly associated with the average parental age at the time of offspring production across all individuals with known paternal age (105 trios), using linear regression. For birds, this relationship is statistically significant after removing a single outlier, the Darwin’s rhea. c, The male-to-female contribution ratio (α) is estimated for groups of vertebrates having at least 30 mutations phased to their parents of origin in each group. The highest male bias (7.6:1) is found in two bird lineages, whereas fishes and reptiles show negligible male bias. The data are represented with 95% confidence intervals based on the binomial variance. The silhouette of Syngnathus scovelli was created by J.S. All other silhouettes are from PhyloPic (http://phylopic.org), except for one of the silhouettes of Sarcophilus harrisii, which was created by S. Werning, and the silhouette of Pan troglodytes, which was created by T. M. Keesey (vectorization) and T. Hisgett (photography); both are available under a CC-BY 3.0 licence (https://creativecommons.org/licenses/by/3.0).

