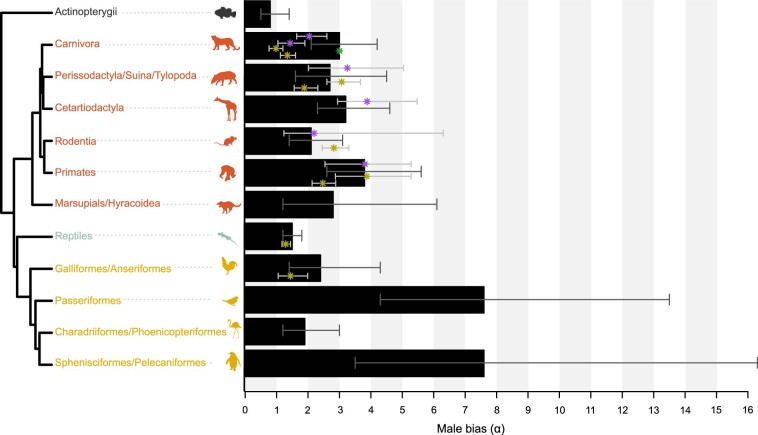
Extended Data Fig. 2. Comparison of published male bias estimates (α) using genome alignments and our male bias estimates (modified Fig. 1c of the main text).
The yellow points are α estimates from Wilson Sayres et al.28, and the purple points are α estimates from Wu et al.31. Most of the common species reveal similar estimates with overlapping 95% confidence intervals. However, the estimates of α based on genome alignments are generally lower for dogs and cats than our estimates, yet the pedigree-based estimate of α for cats (Wang et al.20; green point) is similar to our estimate. See also Supplementary Table 5. The barplots represent male biases estimated by clustering different species per group (to have a minimum of 30 phased mutations per group) and the 95% confidence intervals were based on the binomial distribution. The silhouette of Sygnathus was created by J.S. All other silhouettes are from PhyloPic (http://phylopic.org), except one of the silhouettes of Sarcophilus harrissi, which was created by S. Werning, and the silhouette of Pan troglodytes, which was created by T. M. Keesey (vectorization) and T. Hisgett (photography); both are available under a CC-BY 3.0 licence (https://creativecommons.org/licenses/by/3.0).

