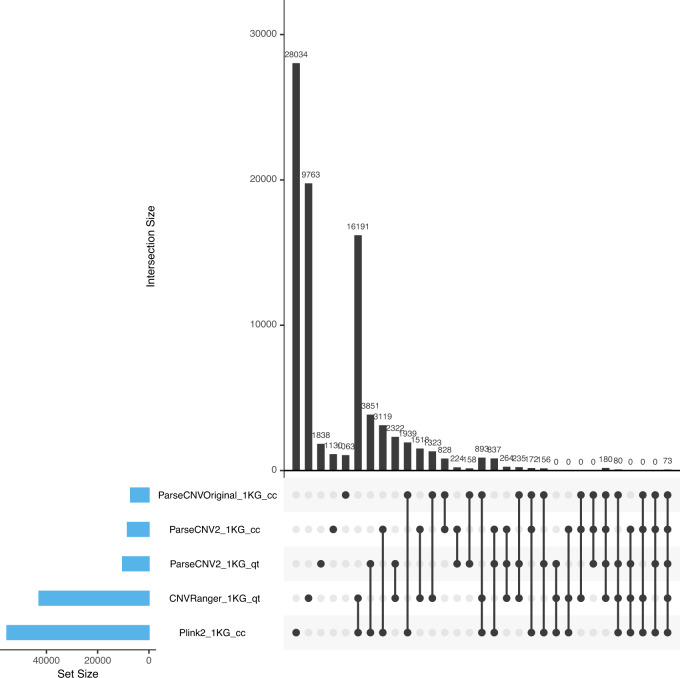
Fig. 3. Upset Plot Comparing Nominally Significant CNVR Loci.
1000 Genomes CNV callset phase 3 from Sudmant et al. [11] with samples split randomly into cases and controls or assigned quantitative trait values to conduct CNV association testing with different methods. The Upset Plot shows 73 nominally significant CNVR loci are detected by all tested CNV association methods. The Upset Plot was generated by R package UpSetR [25].

