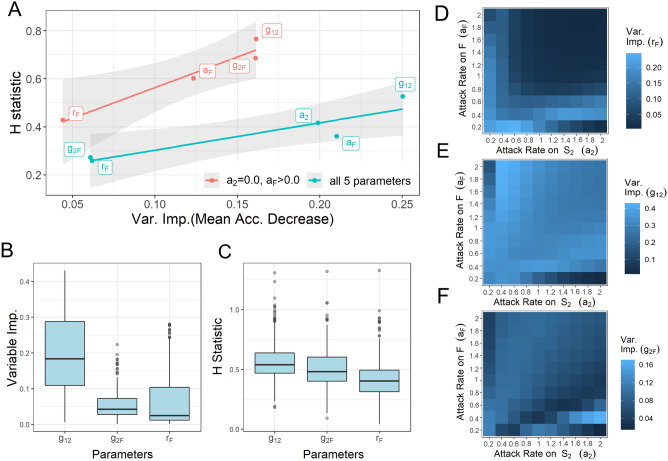
Figure 2.
Random forest output overview. (A) Relationship between Variable Importance and interactivity (H-statistic) of parameters in Random Forest output. Blue line: RF model across all five parameters, AUC:0.998 ( = = = 0.1; = = 0.5). Red line: RF model with single stage herbivory ( = 0); AUC = 0.984 ( = = = 0.1; ==1). Shaded regions represent standard error. (B,C) Box and whisker plots detailing range of Variable Importance (B) and H-statistic (C) for each demographic rate in random forests run with set attack rates where and vary between 0.2 and 2.0 ( = = = 0.1; = = 0.5). Boxes represent the interquartile range with the horizontal line showing the median, the lower box showing the 25 percentile, and the upper box showing the 75 percentile. Upper and lower lines extending from the boxes show the most extreme values within 1.5 times the 75th and 25th percentile respectively. Outliers are shown as single dots. (D–F) Heatmaps showing changing importance for each demographic rate across different allocations of consumption across plant stages. Here we found consistently but only slightly better performance with mtry = 2.

