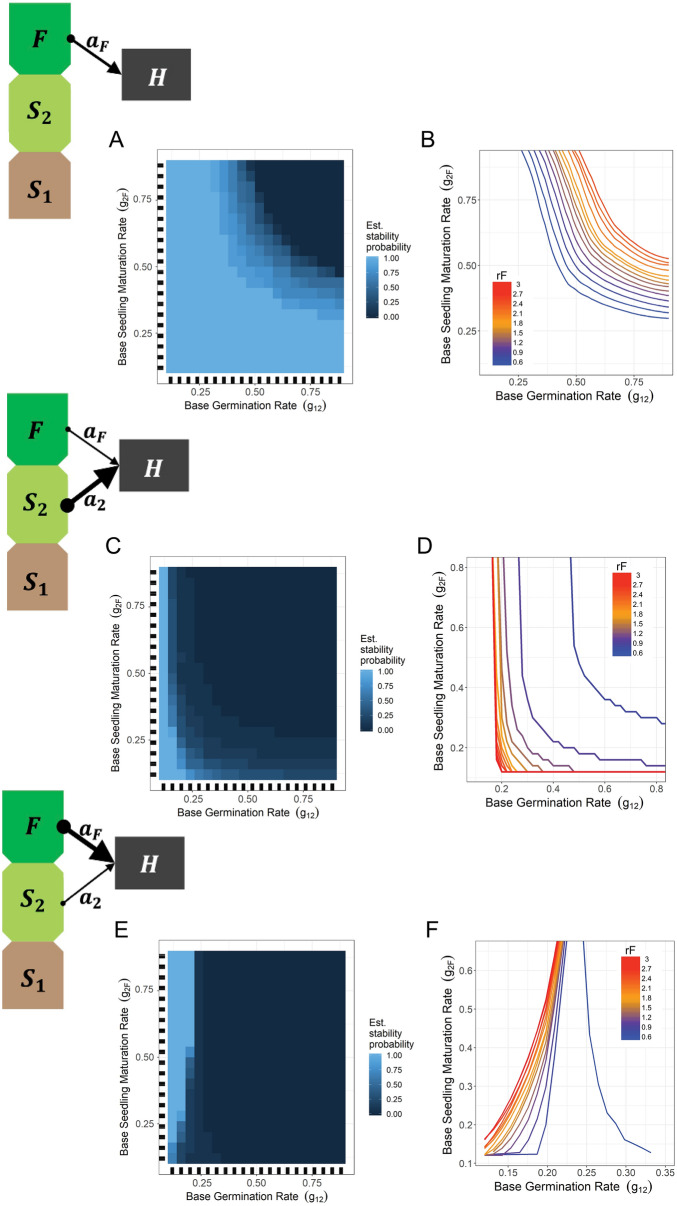
Figure 3.
Interactive feature effects on model behavior. Across different herbivory allocations, partial dependence (PD) plots (A,C,E) show interactive effects between maturation rates on categorical simulation stability. Threshold plots (B,D,F) extend this analysis to include gradations of seed production rates. (A,B) Herbivory allocation = 1.0 and = 0.0. (A) Partial dependence plot shows probability of stability across all values of . (B) Threshold plot shows the location of the threshold between stable and unstable dynamics in {,} parameter space as a function of seed production levels (). (C,D) Herbivory allocation = 0.2 and = 1.0. (C) Partial dependence plot shows probability of stability across all values of . (D) Threshold plot shows the location of the threshold between stable and unstable dynamics in {, } parameter space as a function of seed production levels (). (E,F) Herbivory allocation = 1.0 and = 0.2. (E) Partial dependence plot shows probability of stability across all values of . (F) Threshold plot shows the location of the threshold between stable and unstable dynamics in {, } parameter space as a function of seed production levels ().

